In EnjoyHQ there are two types of taxonomies
- One for Stakeholders, normally people who consume research reports or insights
- And one for Researchers, normally people who do research in your company.
In this video, we are going to learn how to use labels to build an effective taxonomy for stakeholders and how to use tags and properties to build a taxonomy that researchers can use to analyze raw data and build a common language.
First let’s define 4 very important concepts: Labels, Tags, Properties, and Themes.
Let's start with labels.
Labels can be found in the Stories section and in the Projects section. Labels are used to organize your Stories and projects.

Labels are mostly used by read-only users. Read-only users are normally stakeholders who are only interested in consuming the conclusions of your research projects, they don’t want or need to see raw data or your analysis process.
Labels help stakeholders infer what a project or a Story is about.
For example, think about an app for food delivery, a researcher in this company may use labels like:
Usability Testing, Onboarding, iOS app, and Restaurant.
The labels in this example effectively describe what type of research method was used, in which part of the experience, what specific feature or platform, and what type of user.
You can create simple taxonomy based on labels that help non-researchers to filter insights easily.
Now let’s talk about Tags and Properties
Tags and properties are mostly used by researchers for analysis.
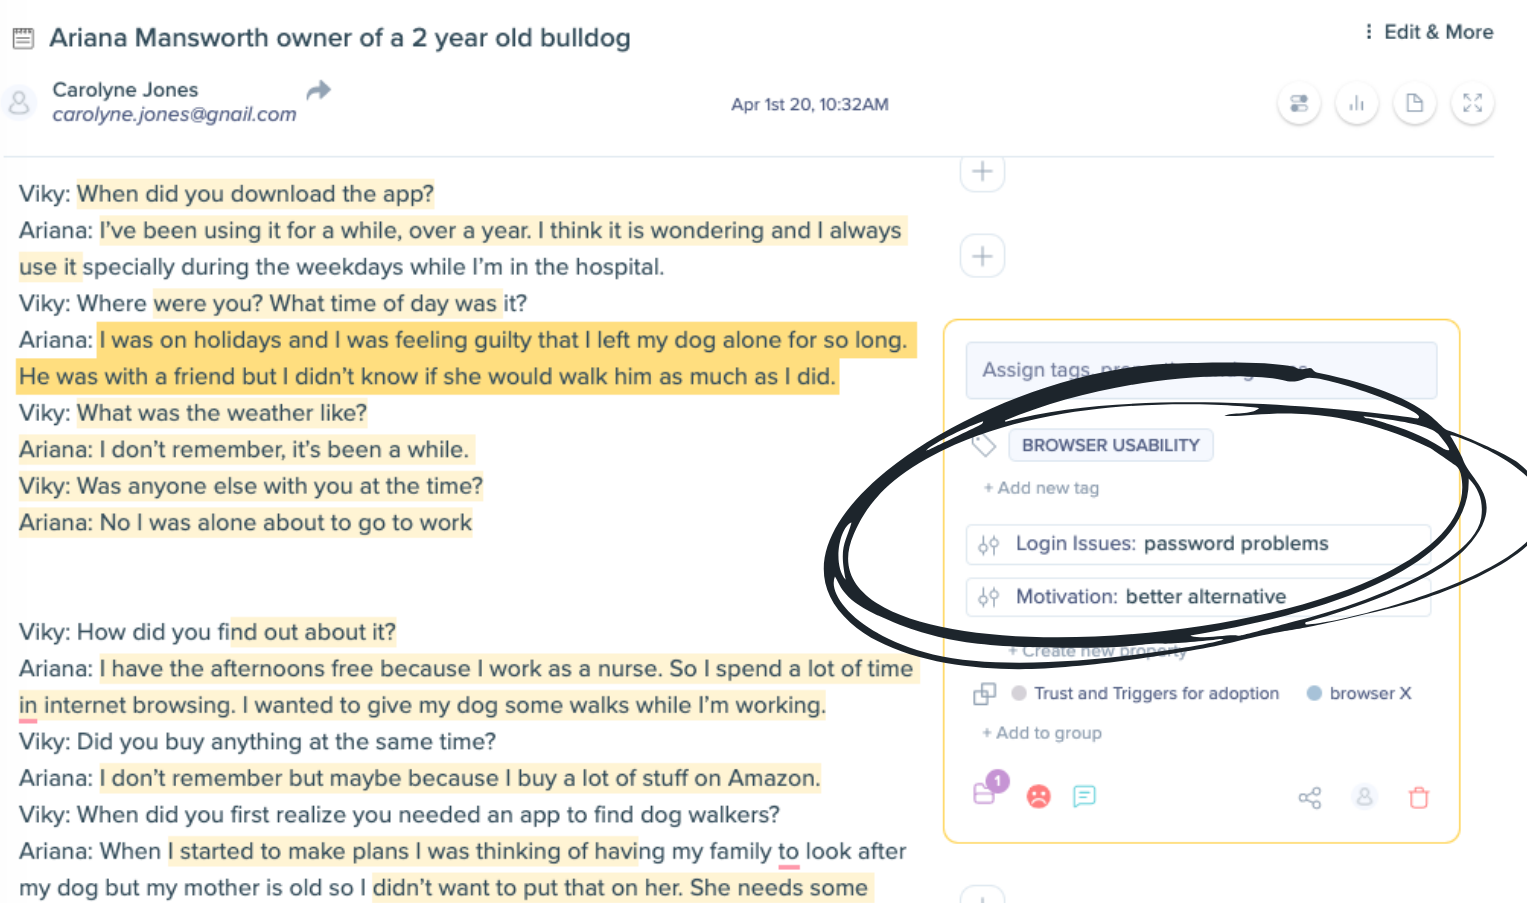
In essence, tags and properties have the same job, they help you classify information however we recommend using tags for high-level classification and properties to define context and detail.
Here are a couple of examples of common tags:
Feature request
UX Issue
Onboarding
Bug
Upgrade
Integrations
General Feedback
Cancellation
Let's talk about Properties
The anatomy of a property is the following: the name of the property and the values you want to associate with it. For example, a common classification pattern is product area, most software products have many features or product areas. You can create a property that captures that easily, for example:
Property name: Product Area.
Values:
Uploads
Exports
API
Check-out
Billing
Properties are great for building patterns that can help you classify data faster and keep the number of tags you need to create low and simple.
Finally, Themes
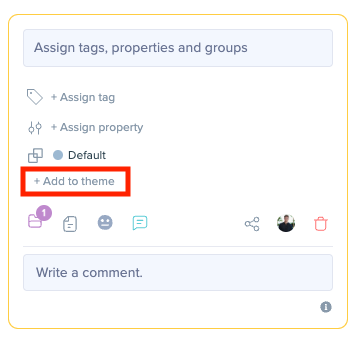
When you click "+ Add to theme" when highlighting a piece of data, you'll be able to create an Analysis Theme or add to one you've already cerated.
Think of these as initial sets of findings that will help you illustrate themes of insights you have uncovered when classifying and highlighting your data.
As you classify your data, pull out emerging themes. Highlights and Documents can belong to multiple themes too. See the example below, a highlight has been added to a theme called "Landing page".
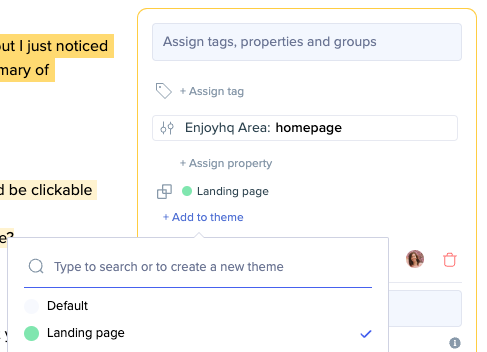
Analysis Themes can be used in a number of different ways. They could help you do some affinity mapping, some thematic analysis or to help you easily create a Story based on your themed highlights.
You can also create themes in the Analysis section clicking the "Create a theme" button.
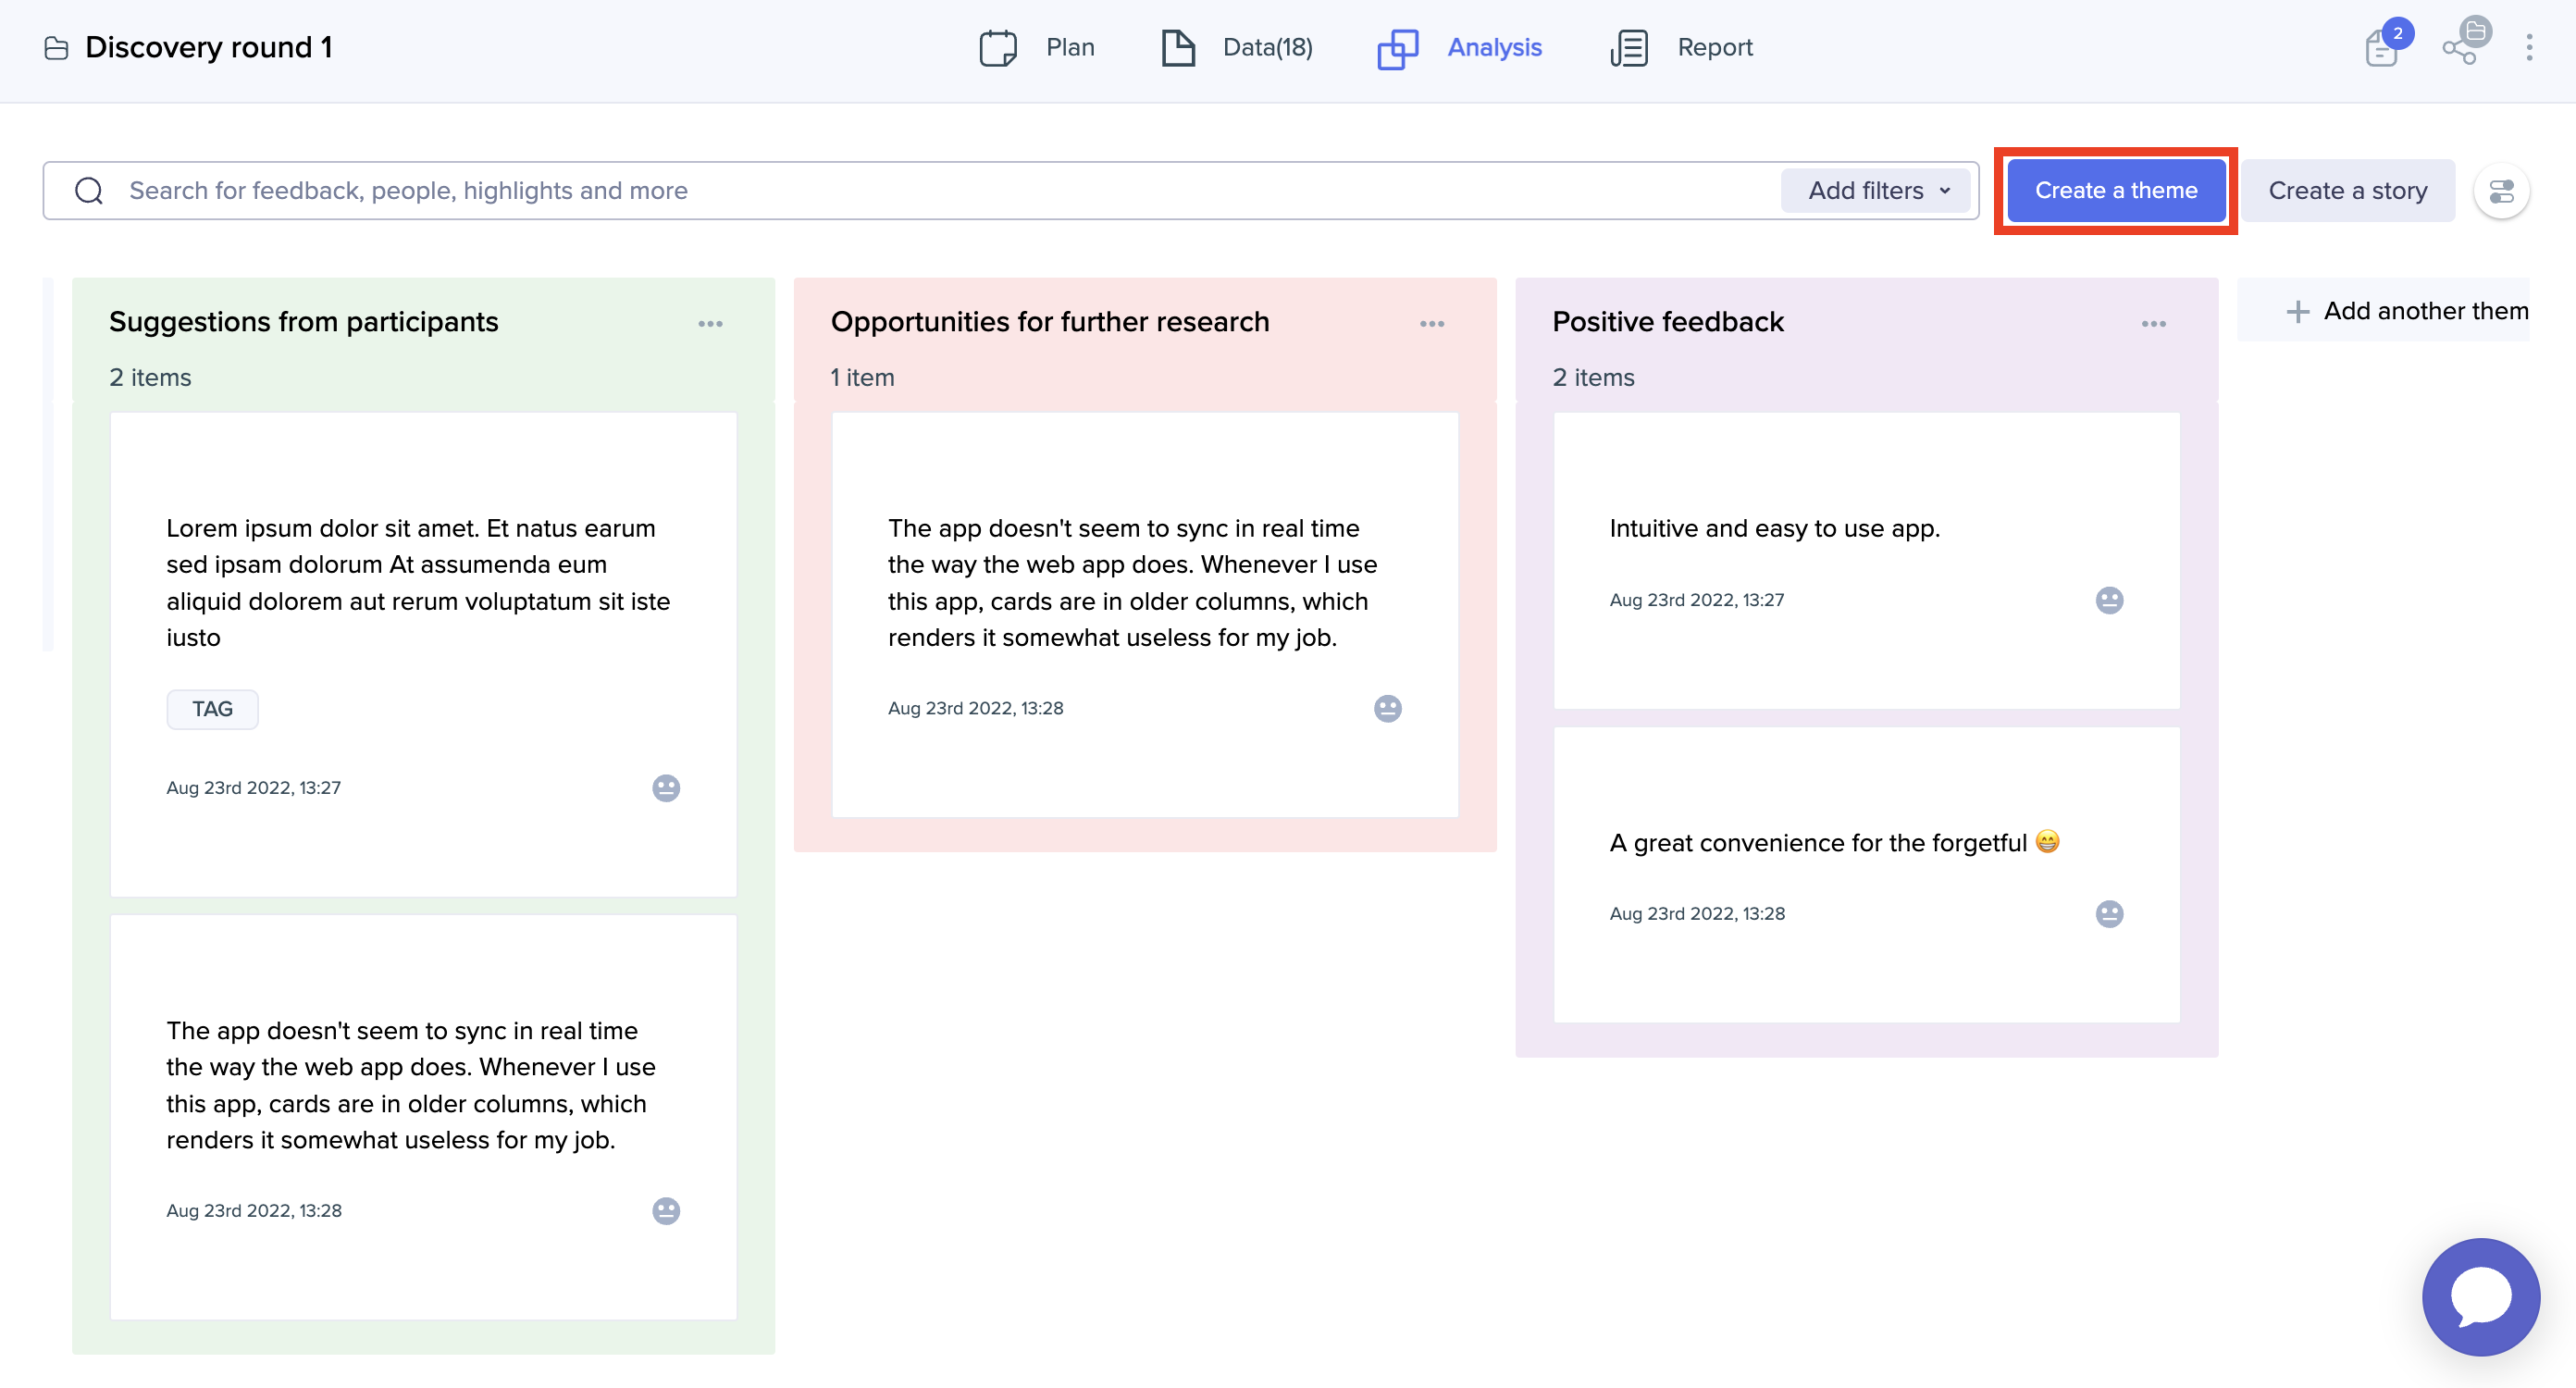
Going back to our initial point about building 2 different taxonomies for EnjoyHQ.
One for stakeholders, normally people who consume research reports or insights
And one for Researchers, normally people who do research in your company.
The label-based taxonomy for stakeholders is normally very stable, it does not change much over time and allows you to offer a consistent experience to stakeholders while your team experiments with tags and properties.
Given the nature of the research work, your tags and properties will change often.
New tags and properties will be created as you come up with new observations or explore a new problem or opportunity areas.
Taxonomies can easily get messy but you can always fix any inconsistencies using EnjoyHQ’s tag manager and property manager.
If you would like to see real-life examples of taxonomies and learn more about how to build yours. Please check the resources below:
Resources:
Here's one of the most practical masterclasses about building taxonomies for research repositories. Watch Taxopalooza!
Taxopalooza Show and Tell (Taxonomy examples)
Key concepts in EnjoyHQ: Building the structure of your Research Repository
A Practical Guide to Building Taxonomies That Make Data Truly Useful to Your Business