In this article, you will learn everything you need to know about creating powerful research projects in EnjoyHQ.
Projects are specially designed to help you track data, organize findings, and tell a compelling story around your insights.
Creating Projects
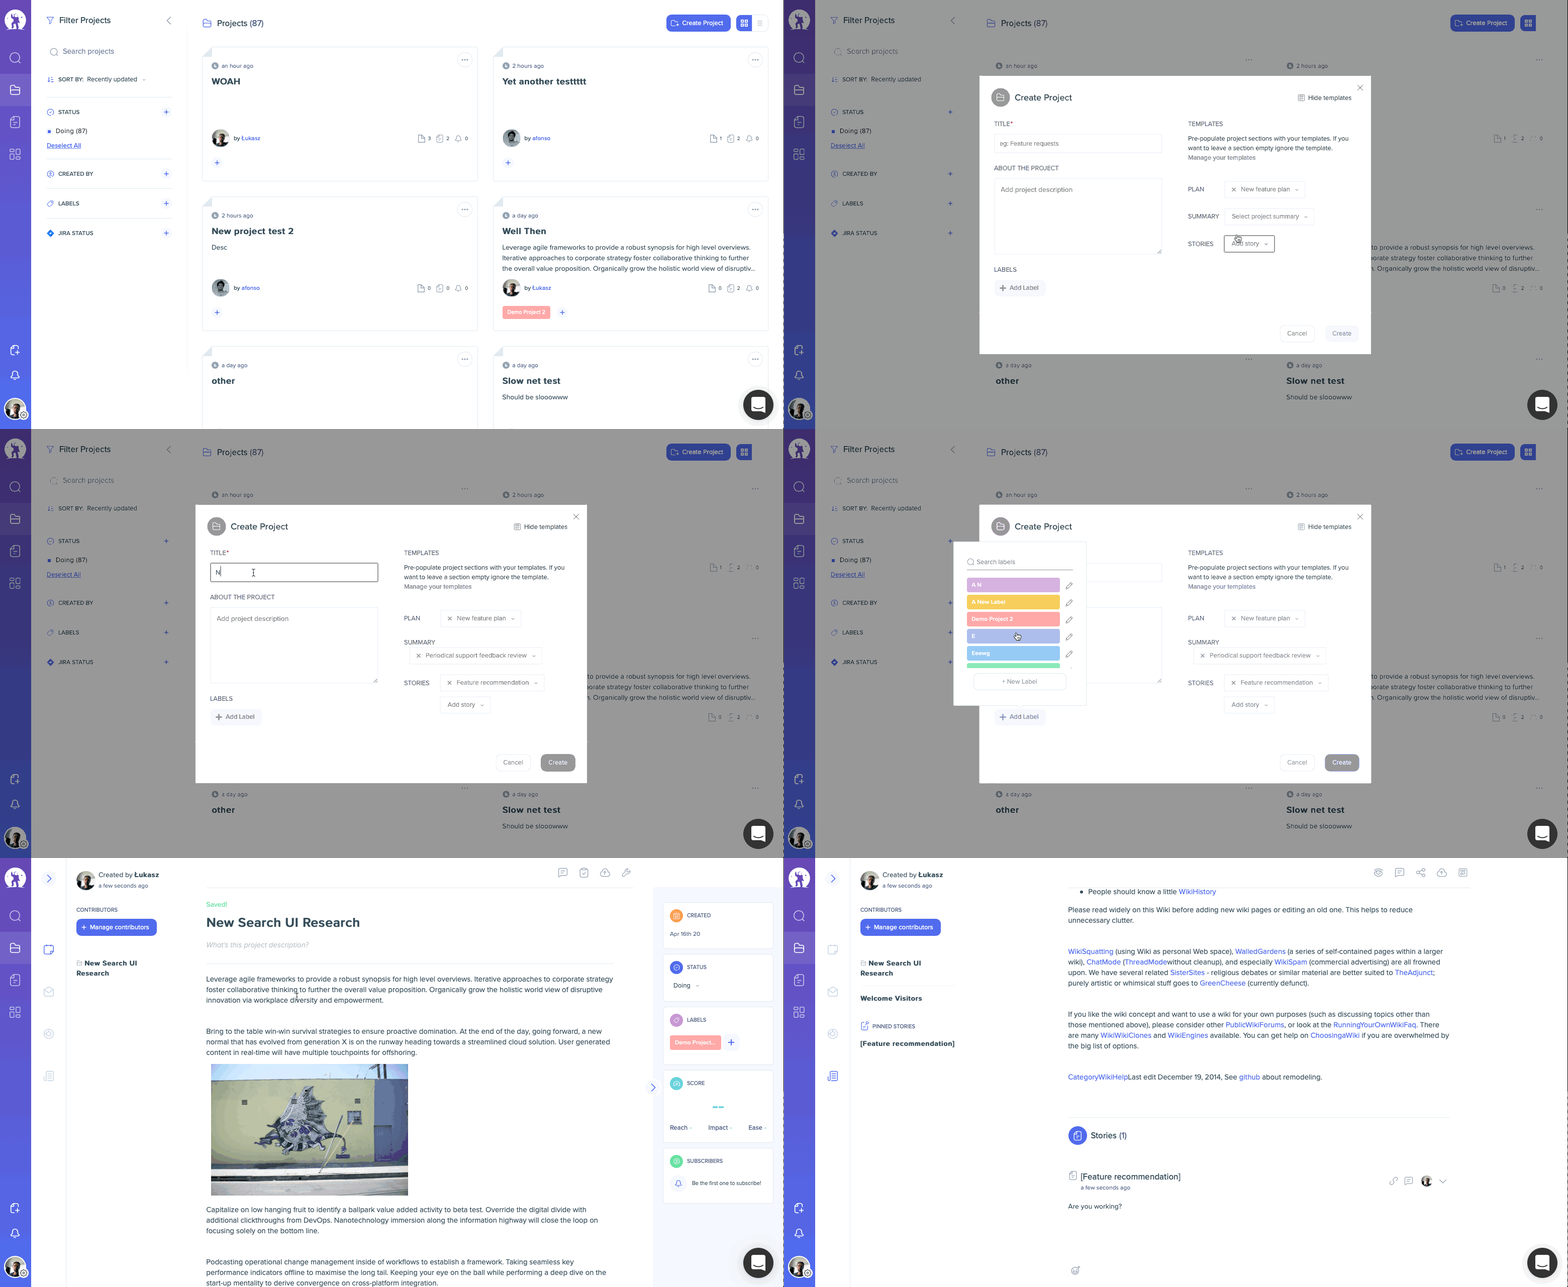
Projects can be created from the project list. While doing so - you can also use any Project Plan, Report, and Story templates available in your account:
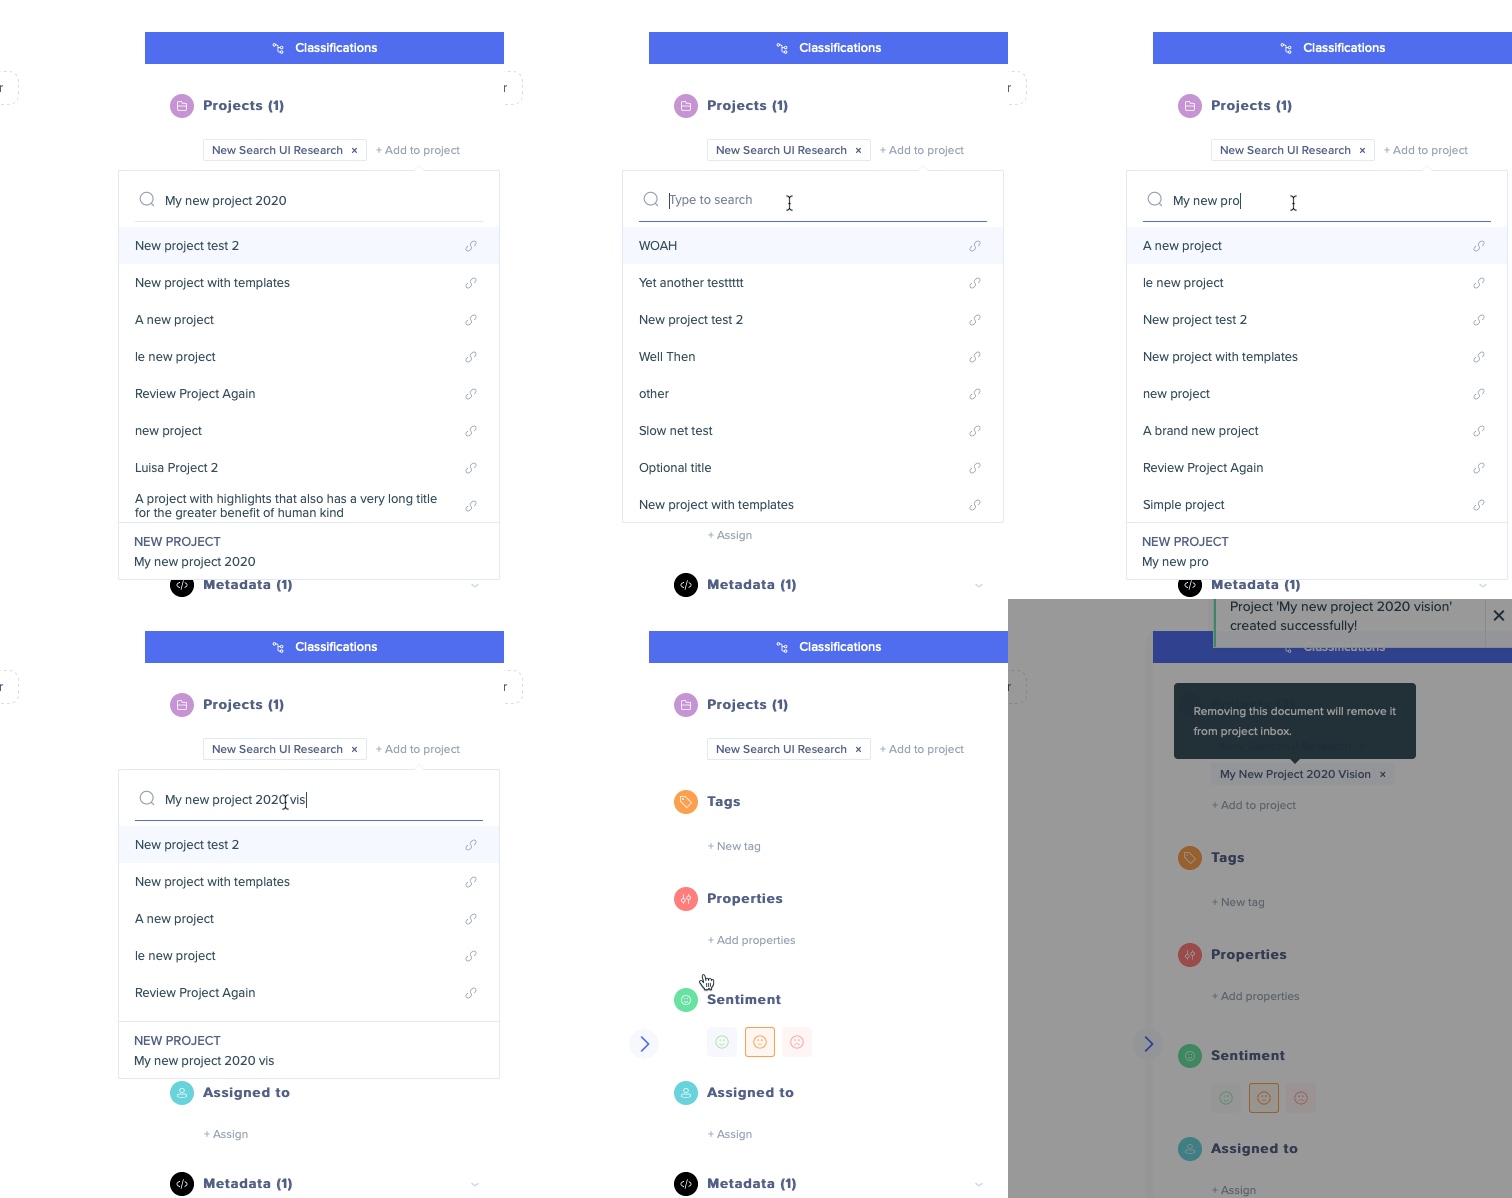
Alternatively, you can create projects straight from the document's sidebar or the highlight editor:
A project has four sections:

1. Plan
The Plan section is where you can flesh out your research plan. Here, you can describe the scope of your project, research goals, methodology, participants, etc. This section has a handy checklist feature to help you organize your tasks and collaborate in real time with other team members. Once your research plan is done, you can gather data about your research question.
2. Data
This is where you want to store and ideally automate the centralization of all the data relevant to your research project. This could be customer interview notes and transcripts, customer feedback from different sources, videos, etc. The Data section works as a loose inventory of any data you’ve collected that you will eventually analyze.
3. Analysis
You can think about this section as the initial set of findings that help you illustrate some of the insights you have found in the data. Here is where you start shaping your initial understanding. All these data points will eventually help you tell the story behind your findings.
4. Report
This is the section where you will report on the insights you've uncovered to the rest of the organization. Use this section to write an executive summary and add stories below for your stakeholders to read and digest easily. Instead of a slide deck, this is your way to tell a compelling story that can truly communicate the facts behind your research in a quick and easily readable way.
Let’s have a look at how everything works together!
✍️ Plan
This is where you will outline the goal of your research, methodology, and set other project attributes.
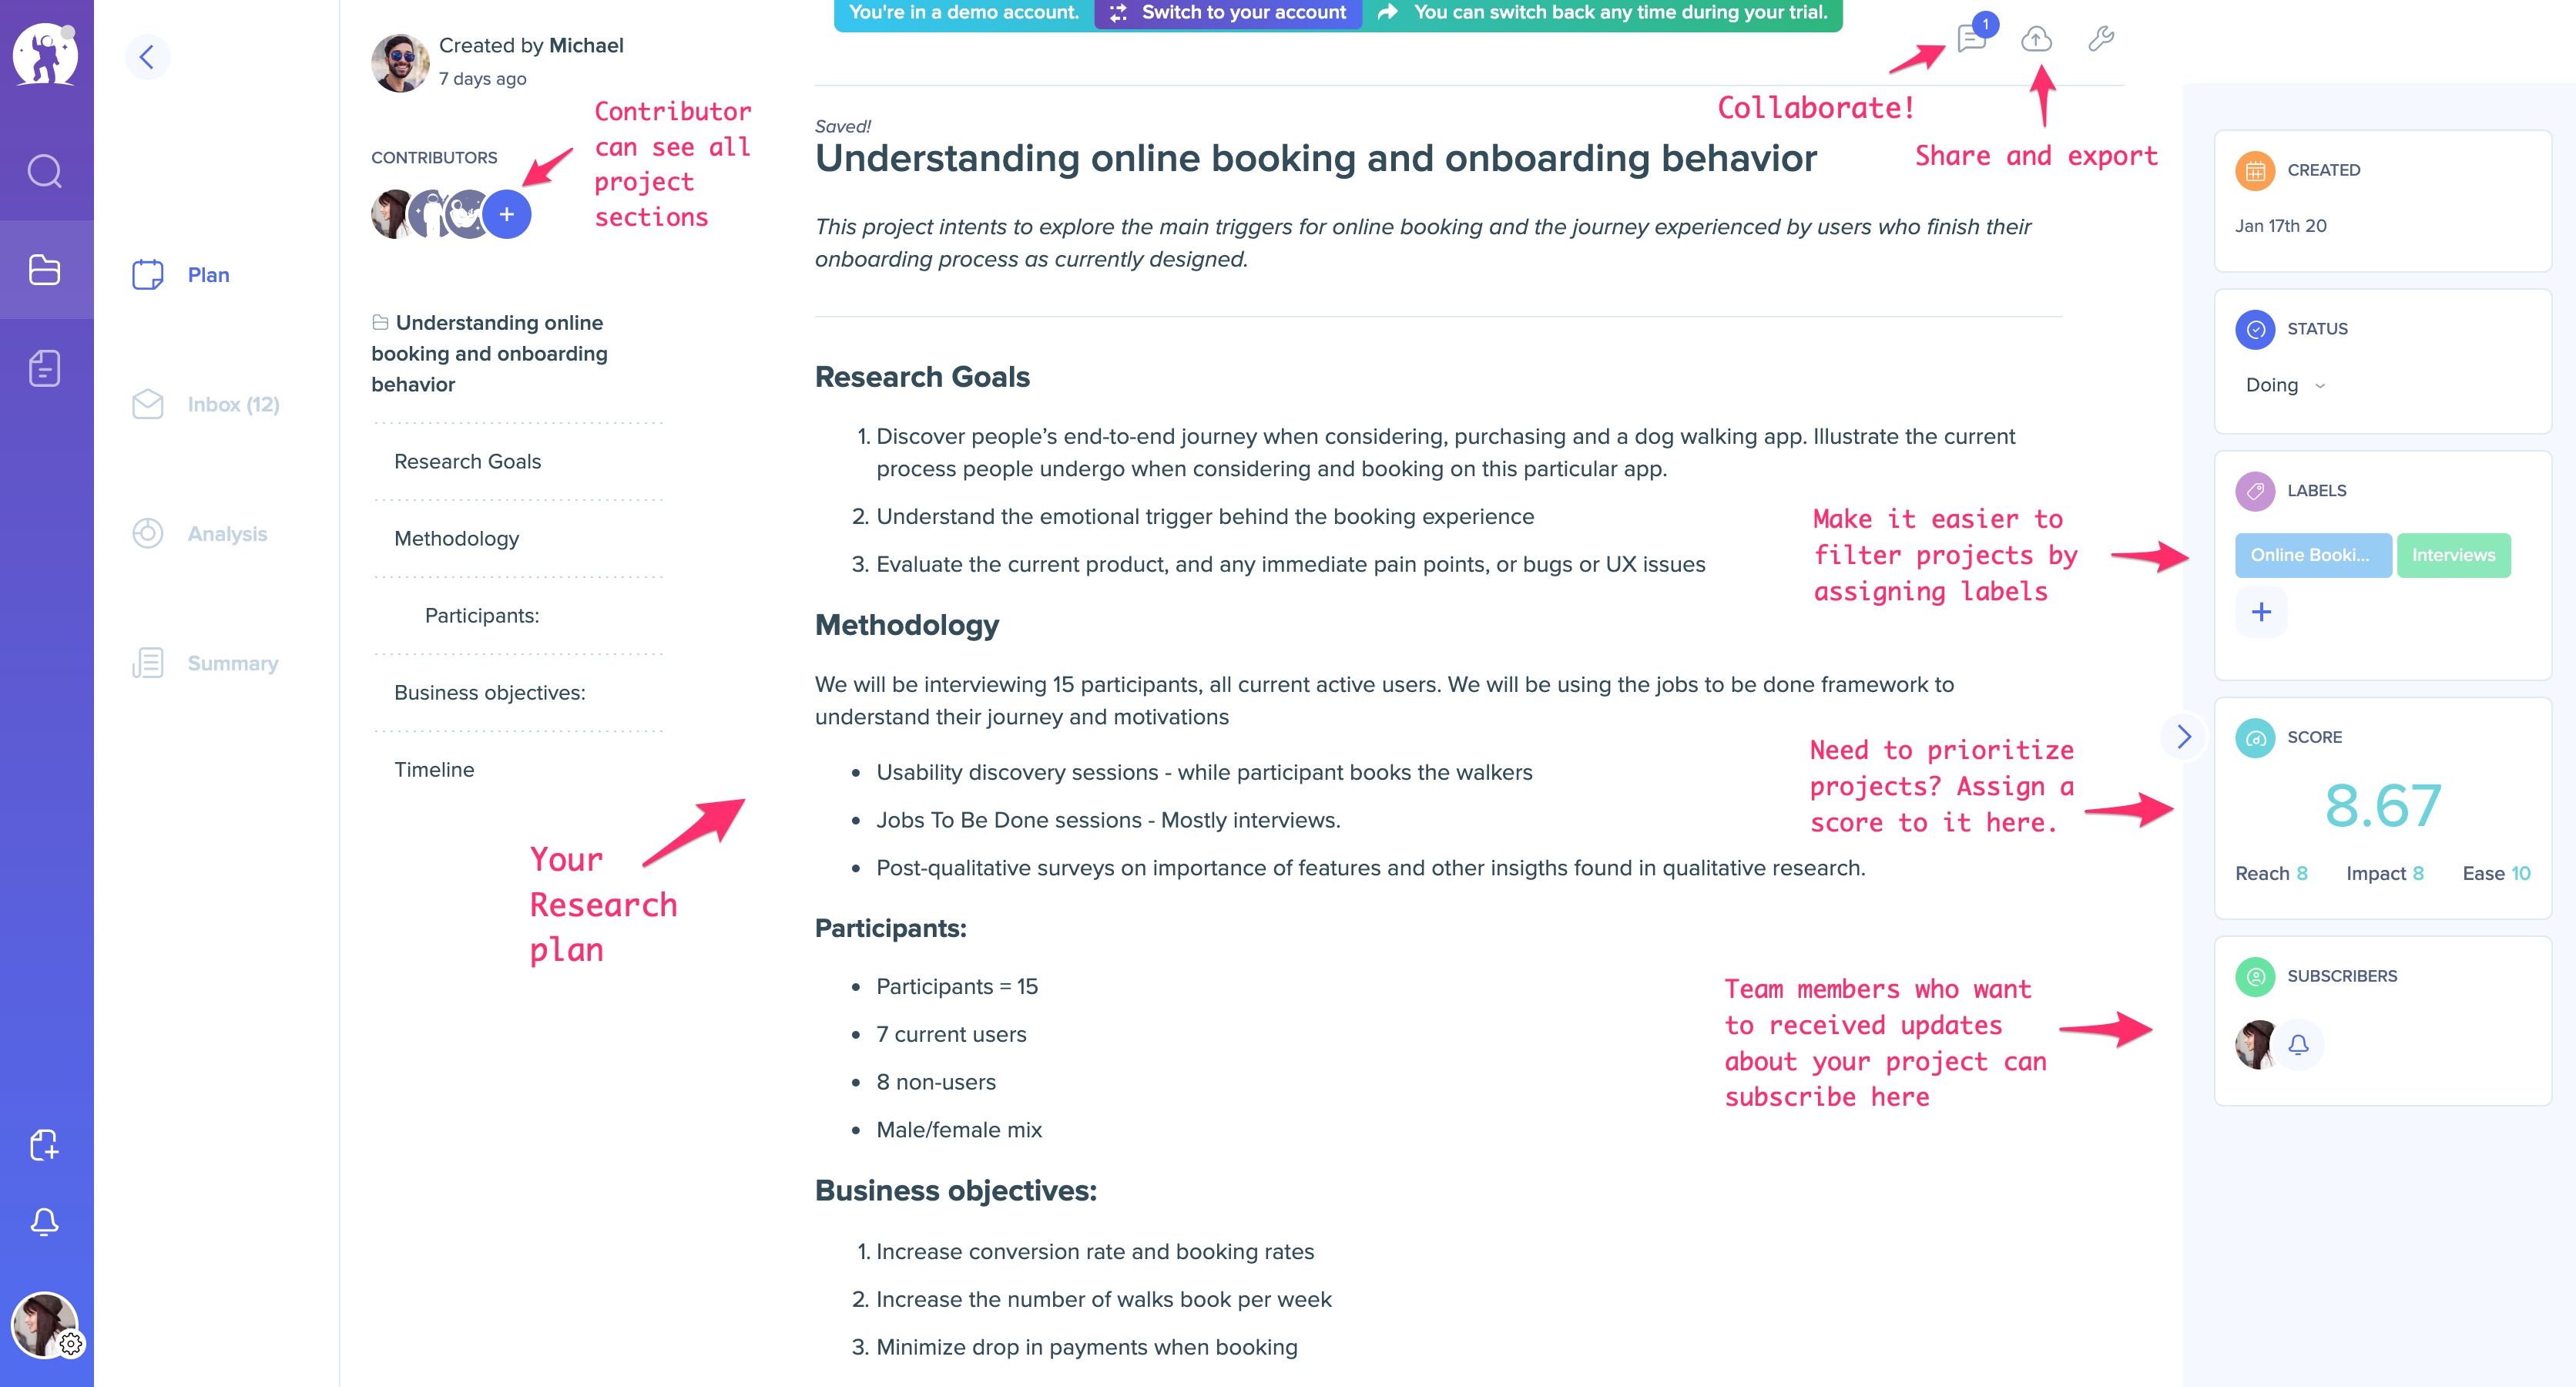
In the Plan tab, you can:
- Add a title and description to your Project
- Manage the status of your Research Project
- Add custom labels to your Research Project (i.e.product areas, verticals, touch-points etc)
- Subscribe to email updates
The project's status and labels help you to organize your research by indicating if it's planned ("To Do"), in progress ("Doing"), or completed ("Done"). Labels can help you to indicate the nature of the project ("initial research," "usability testing") or the product area being researched.
If you're importing past research activities - you can edit the project's creation and completion dates.
The plan is meant to be collaborative - share the URL with your team so they can join you to create content with you in real time and add comments to open a discussion.
Optionally, if you have connected the Jira integration, the plan section allows you to link your project to an existing or new Jira issue.
Project access permissions
By default, as the creator of the project - you will have access to all of its sections. Other administrators and collaborators can also access your project.
Read-only users have only access to the report section of the project unless project settings are changed.
Assigning priority to your projects
You can assign a simple prioritization score to your project - you can learn more about the scoring feature here.
Subscribing to project changes
You can choose to receive updates about any changes to a project.
If any of the following changes happen, updates will be included in your notification email:
- New content (document or highlight) is added
- Project's "to do," "doing" or "done" status changes
- Project's score is set or changed (read more about project scoring here)
- If a project is linked to a Jira issue and that issue's status changes (read more about Jira integration here)
- When a story is created inside of a Project
- Project's Report or Plan's content changes
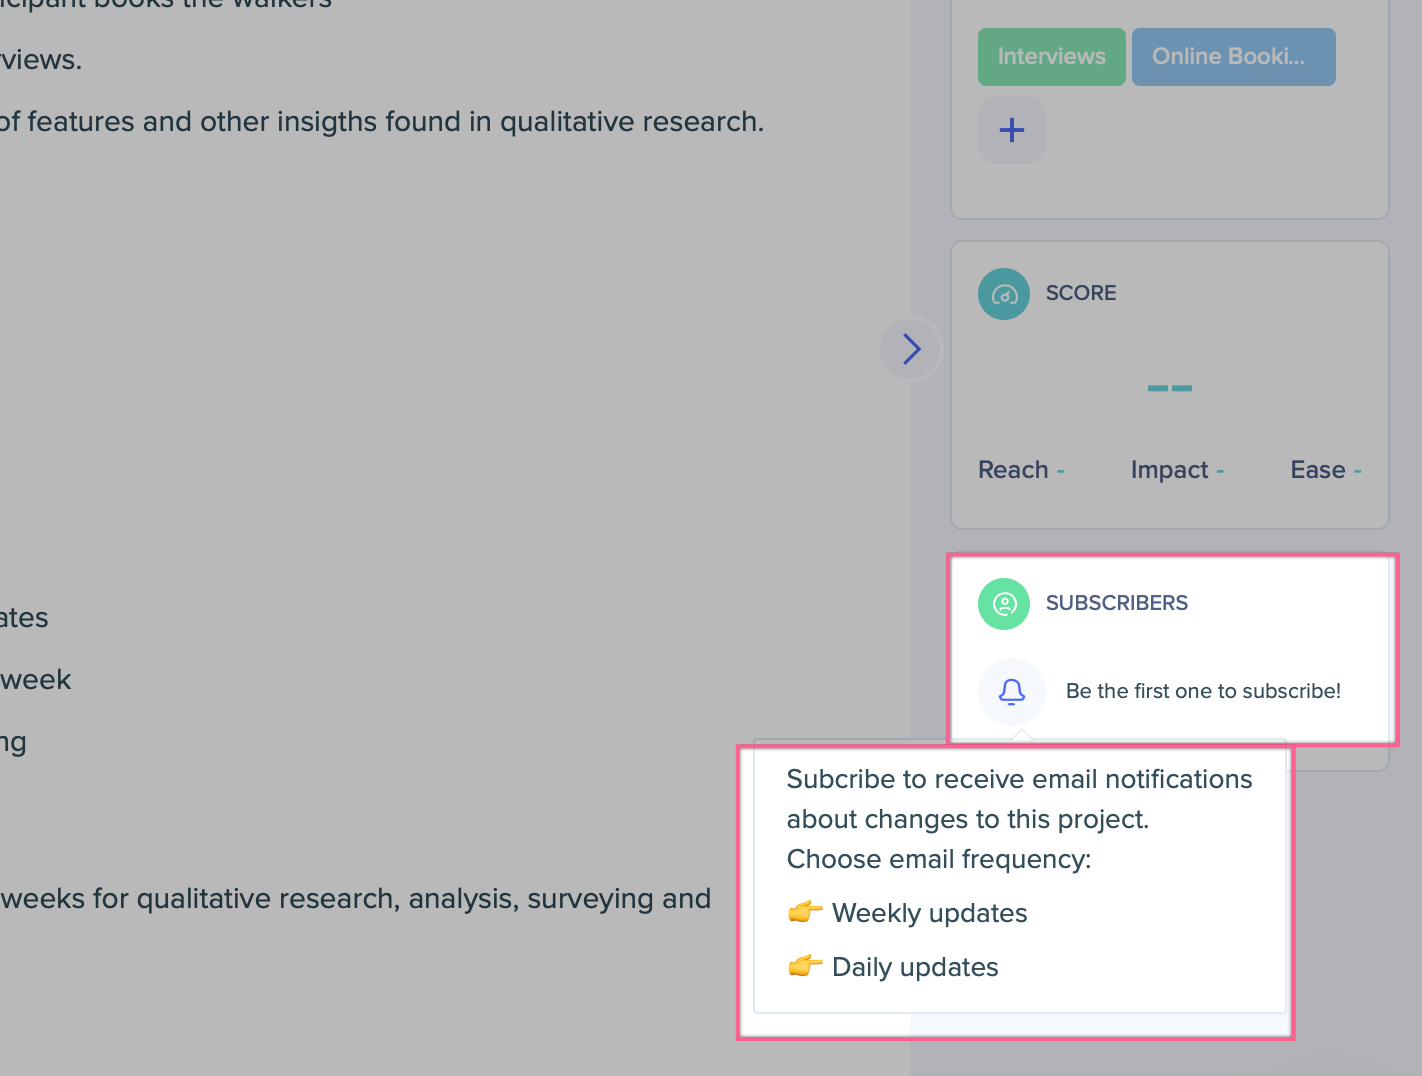
You can choose to receive weekly or daily notification emails.
To subscribe, click on the bell 🔔 icon and choose how often you want to be notified:
🗃 Data
Adding data to your project
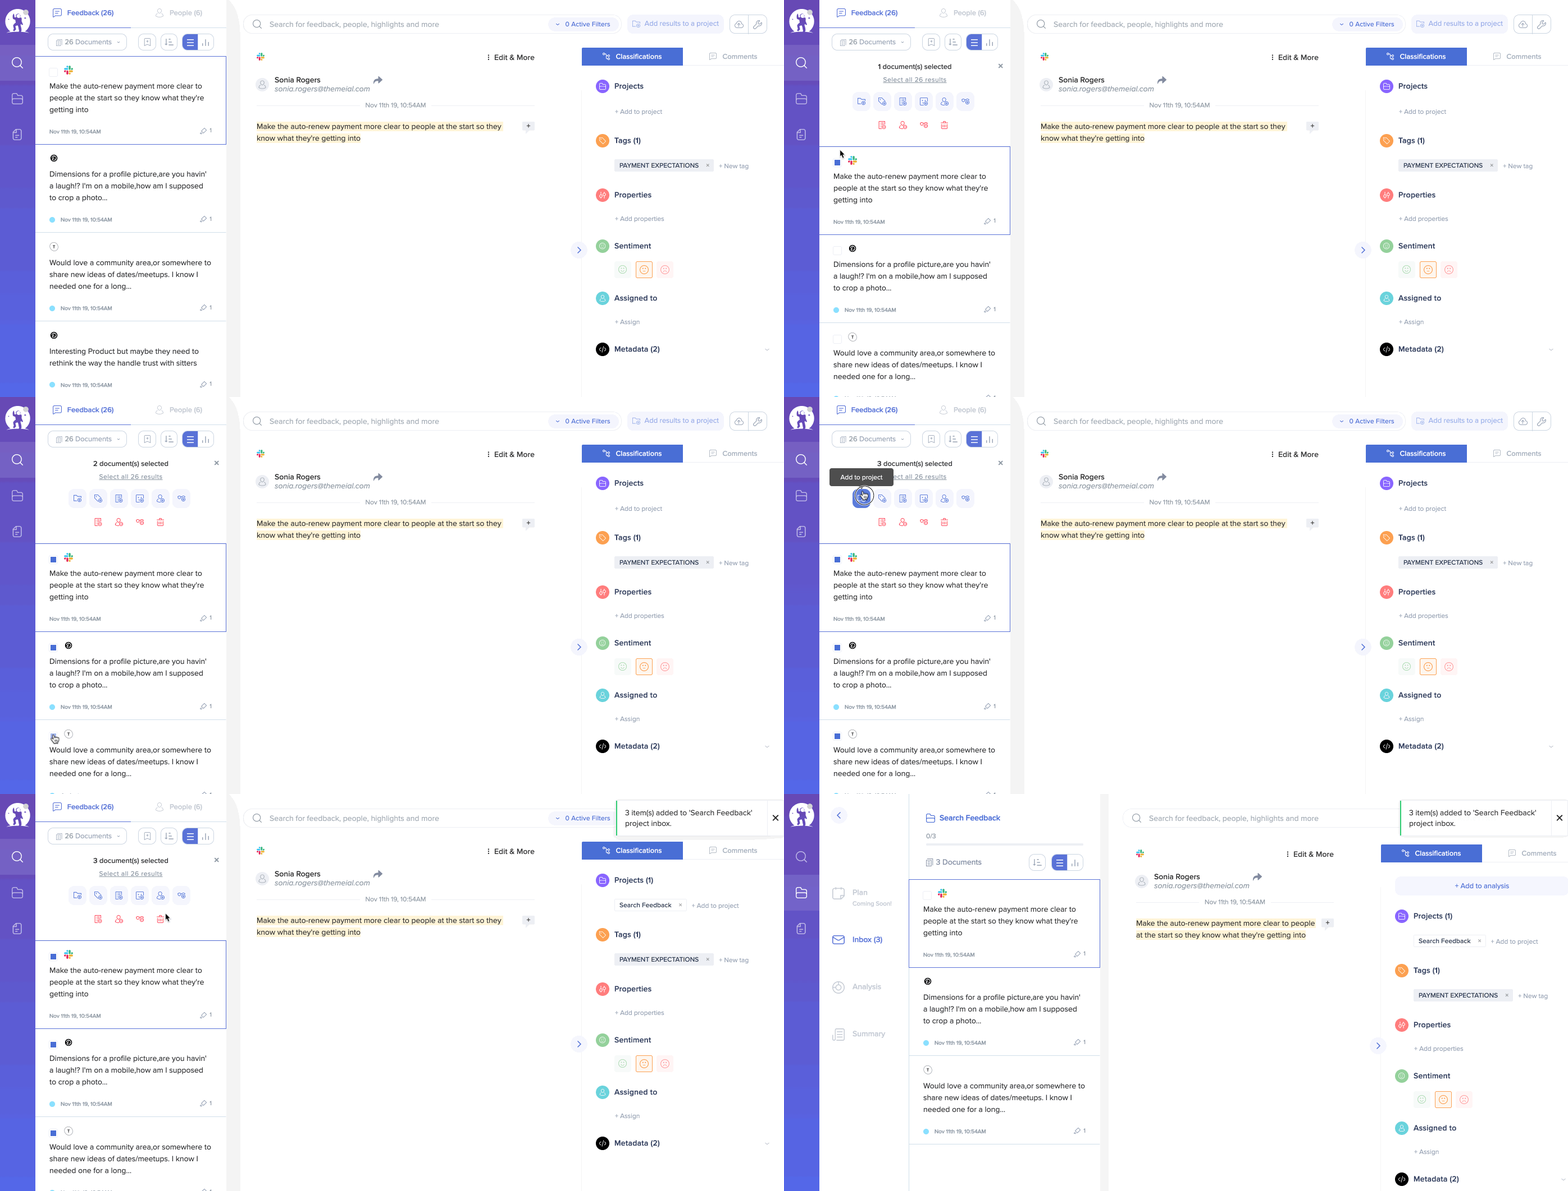
You can add data to your project by uploading files directly or by adding data from your main repository in the Search area:
Add your search results to a research project using batch editing features.
Automating workflows
Rules allow you to set a series of conditions; whenever those conditions are met, you can trigger actions. One of the actions you can trigger is sending specific feedback to a project's data section.
You can get started by clicking on the settings (🔧) icon and selecting the "Automate project" option:
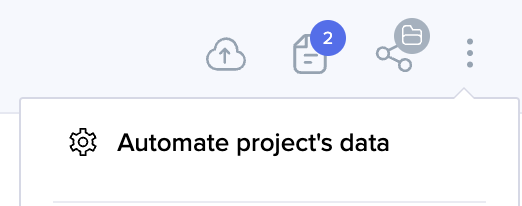
To edit the rule you've created to automate your project's data, you can use the same button in the dropdown as above.
Let’s say you are interested in tracking any customer feedback that mentions the keyword “Uploads". You can easily set up a rule that tracks that feedback and automatically sends it to your preferred project. Learn more about Rules here.
Analyzing data in your project
Ready to analyze your data? You can do so by highlighting the snippets of text that are most relevant to your research. Each of those snippets and data points will be added automatically to the analysis board.
You can classify your snippets using tags and properties. You can also assign sentiments and add comments to them.
As you classify your data, you will start identifying patterns and themes across all data points. The analysis section helps you organize those findings easily.
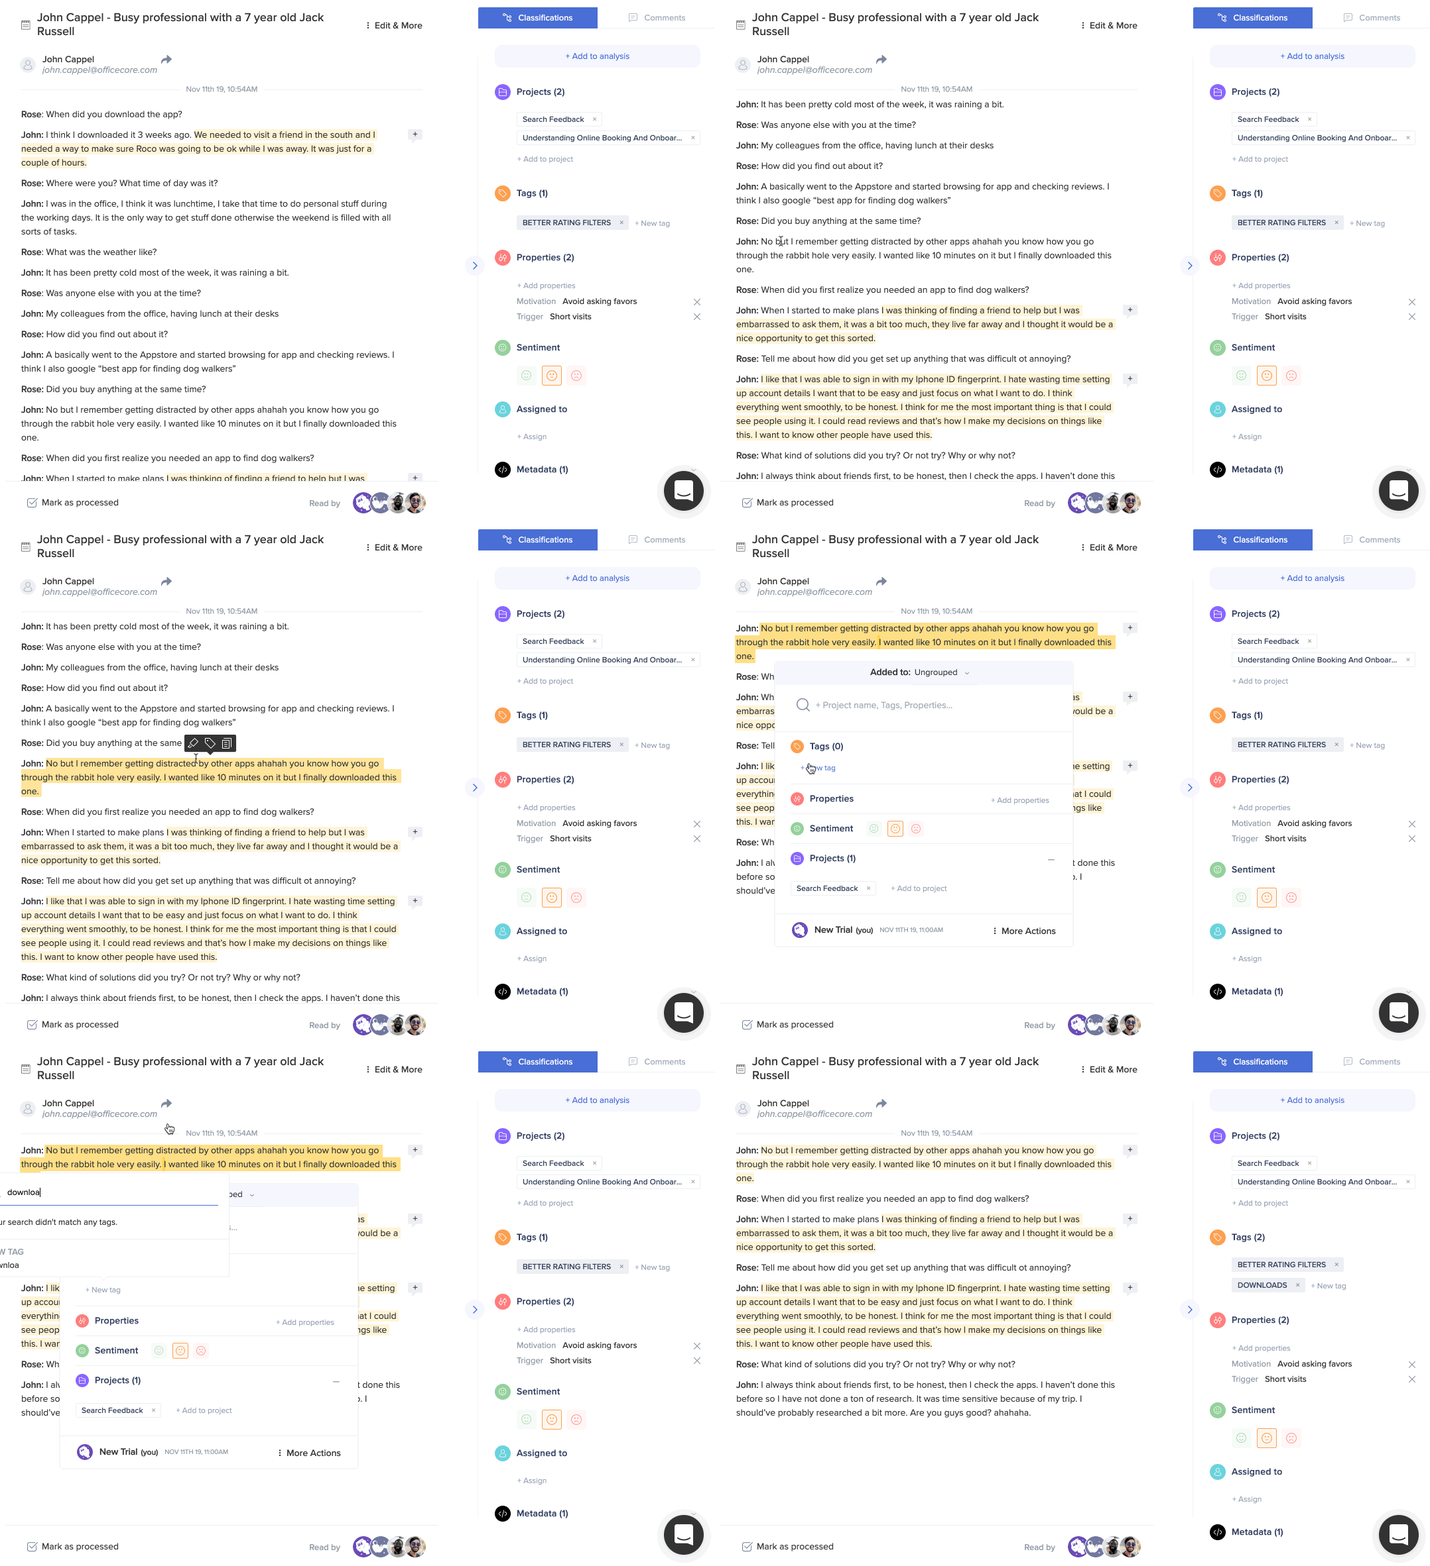
While analyzing your feedback and classifying it with tags and properties, you can also add your highlights to the analysis board.
Removing data from your project
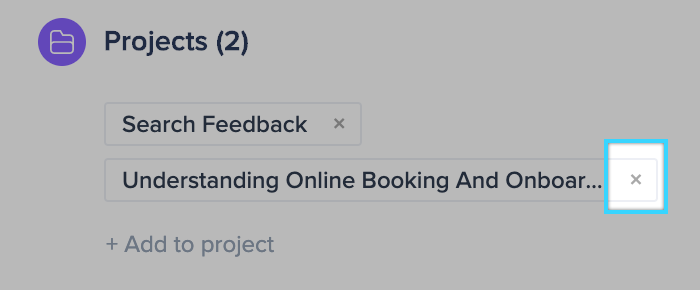
You can remove individual documents by clicking the X icon on the right-hand side of the document:
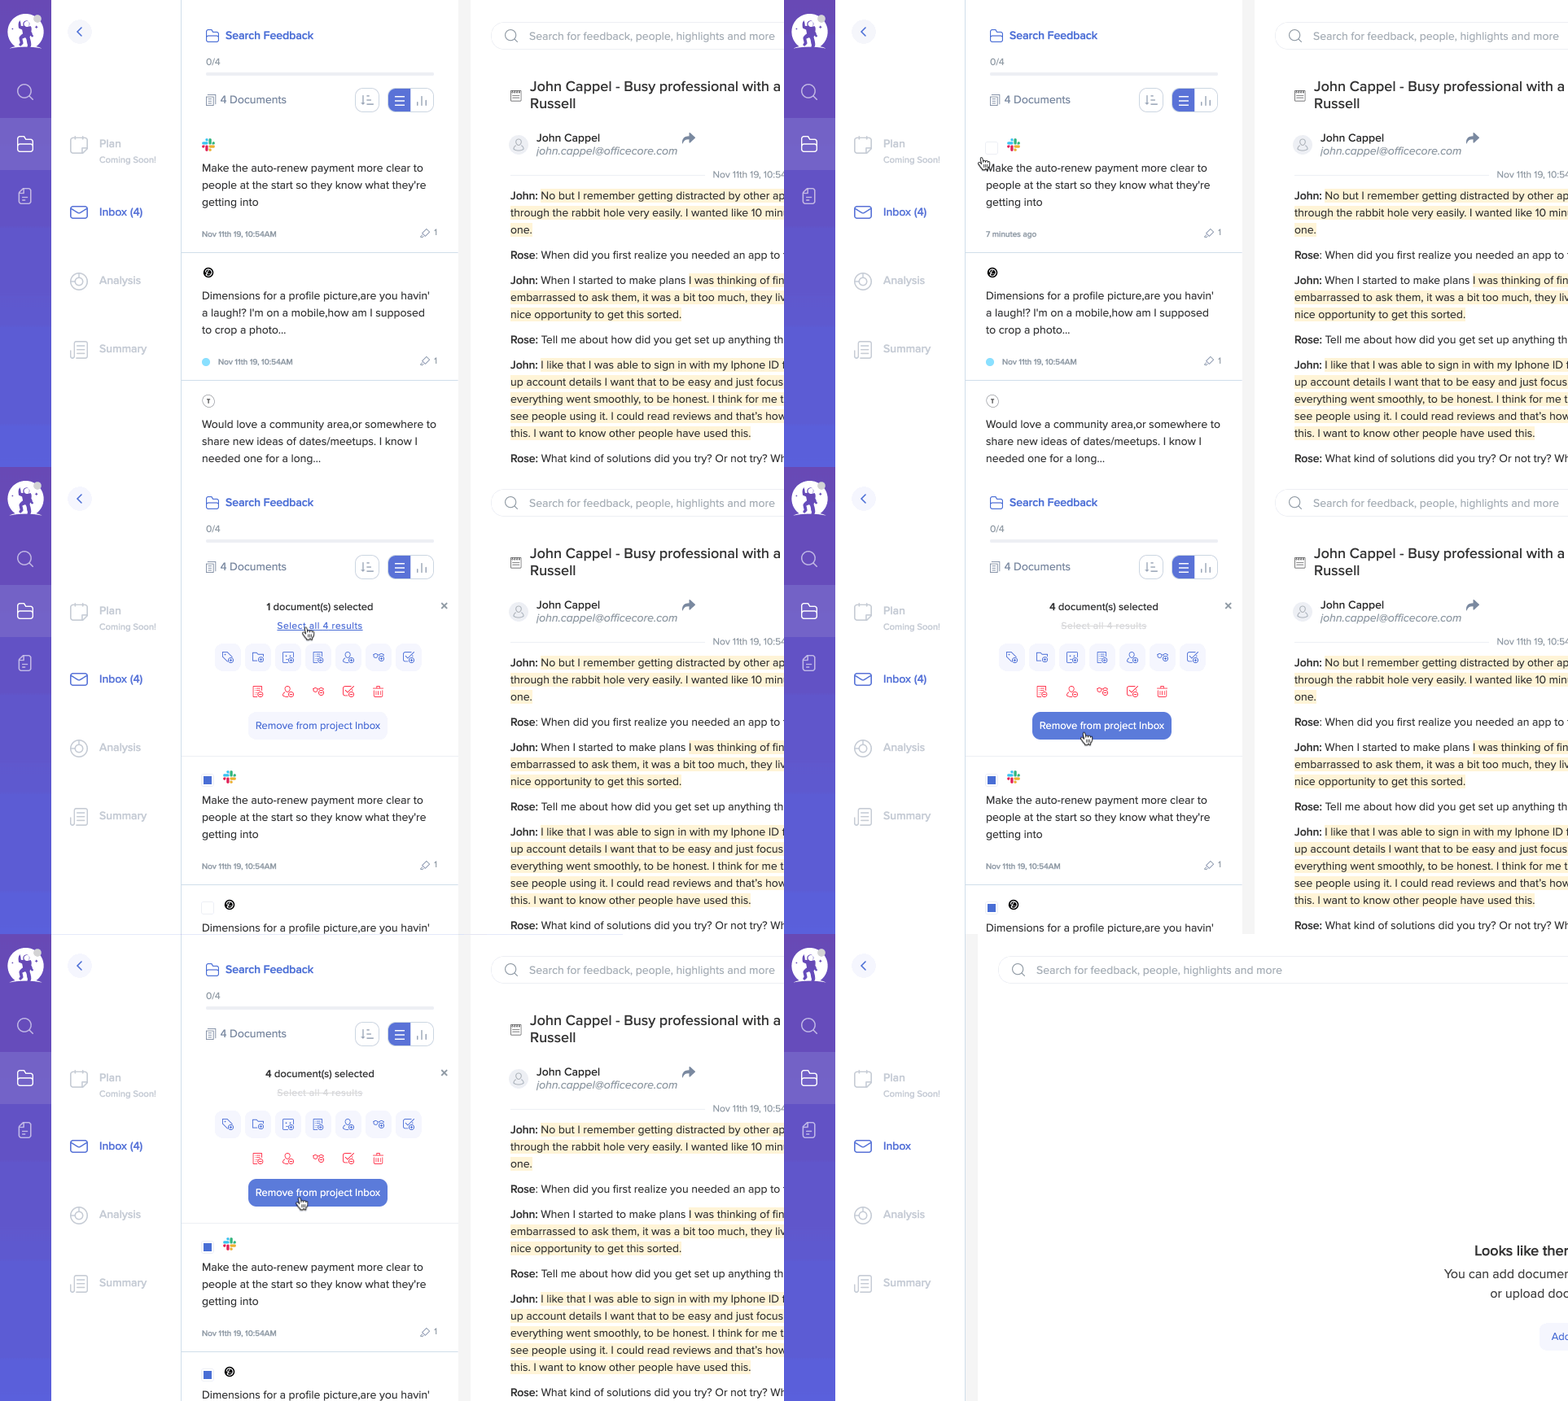
To remove multiple documents, hover over the documents list, select, and batch remove as many documents as needed:
Getting things done with "Mark as processed."
Once you have finished analyzing a document, you can mark it as processed; that way, you keep track of what has been reviewed. Once you mark a document as processed, the progress bar will update accordingly:
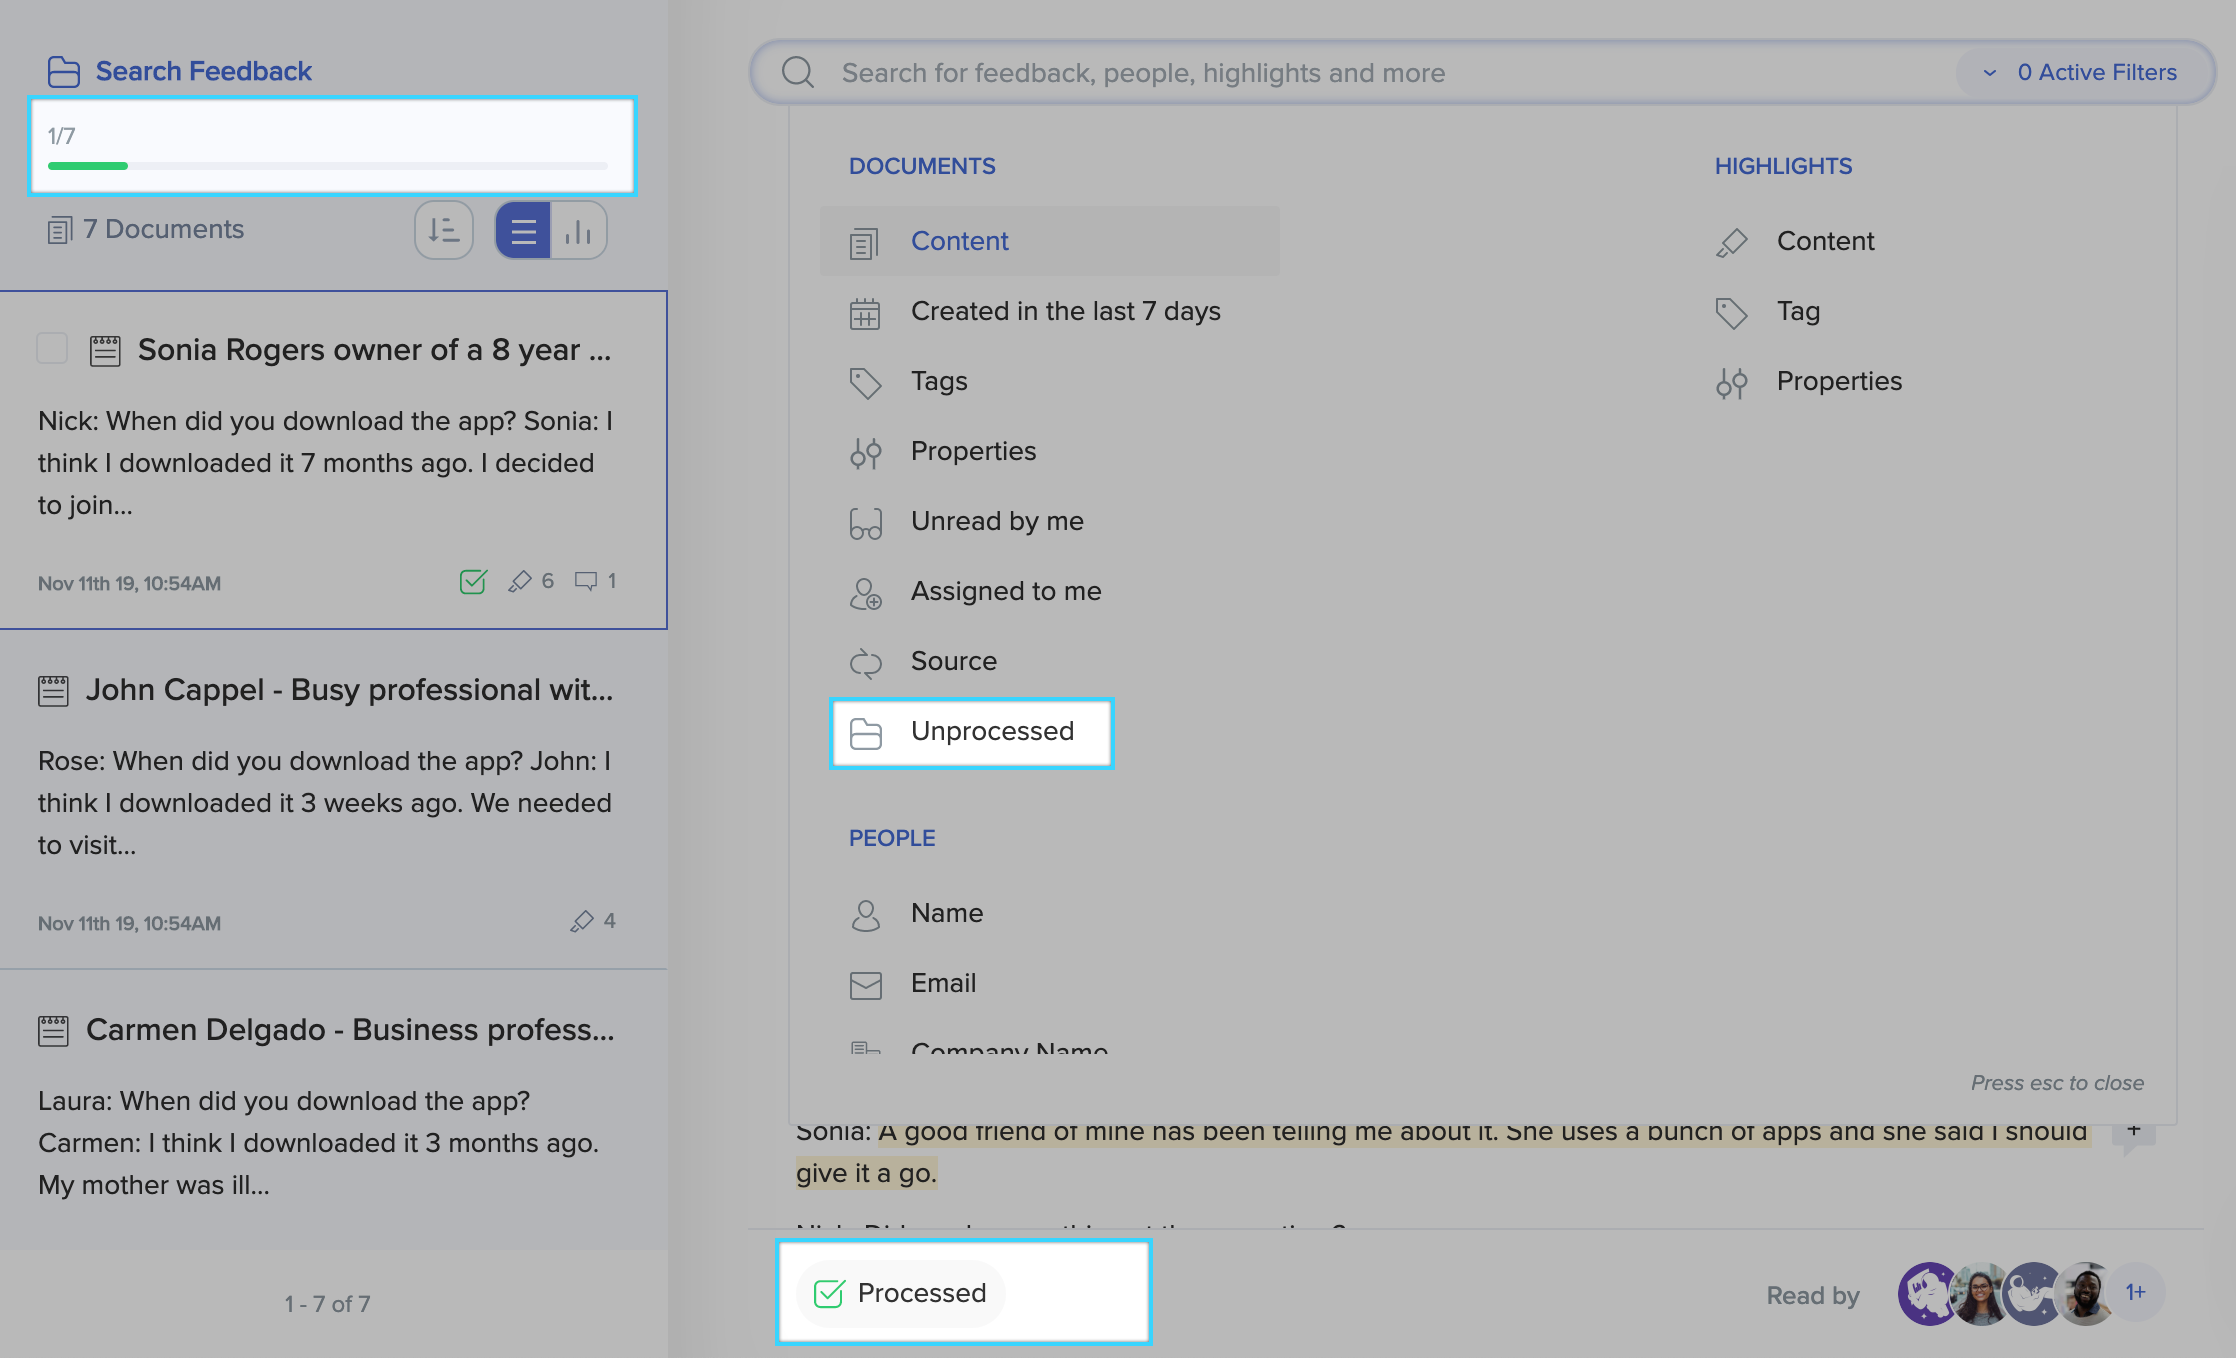
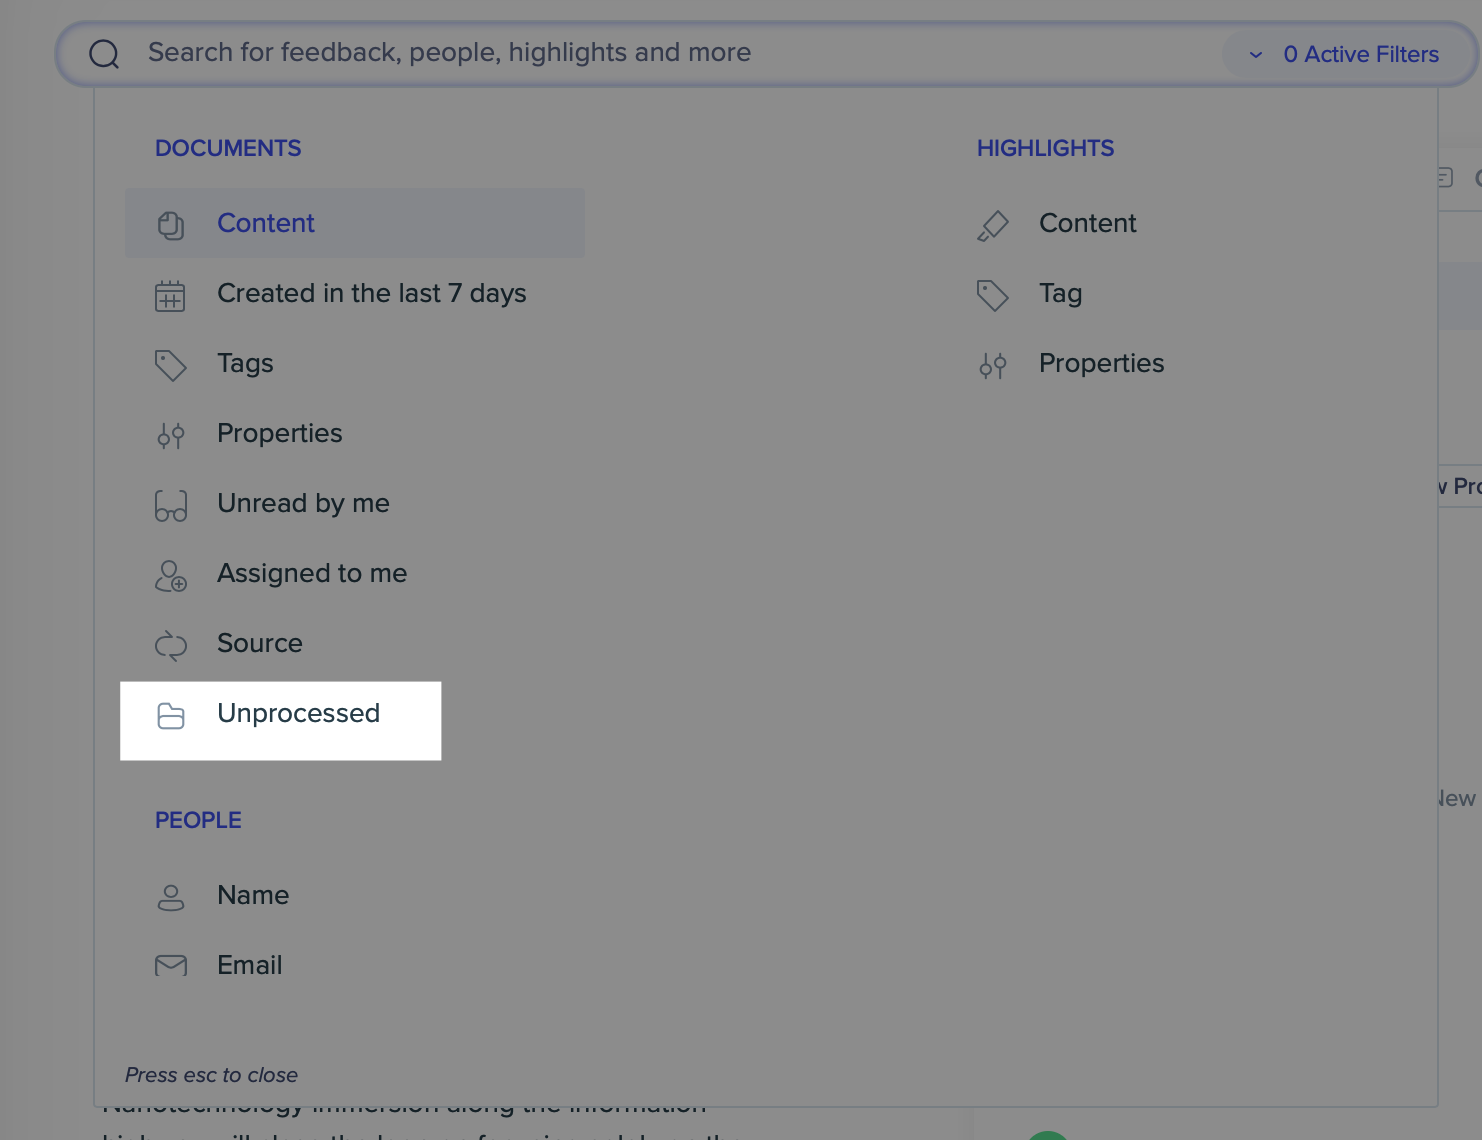
The search shortcuts allow you to quickly find unprocessed feedback in your project so that you can pick up where you left off or see any new documents added to your project.
Viewing all the highlights in your project
You can see all highlighted pieces of feedback, regardless of whether they're present in the analysis board:
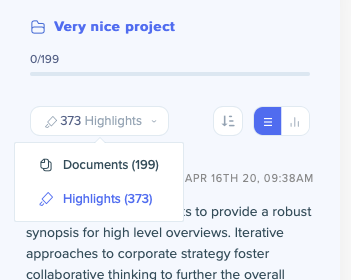
In this view, you can use batch editing controls to send multiple highlights to the analysis board quickly.
📊 Analysis
Once you have found and classified all your data in your project, you can:
- Organize your insights into themes
- Organize themes
- Filter data by tags, properties, customers, and more
- Capture insights in the form of stories
Adding findings to the analysis board
Any highlight created in the project's Data section will be automatically added to that project's default theme in the analysis board. You can also add your highlights (or documents) using batch actions in the Data section:
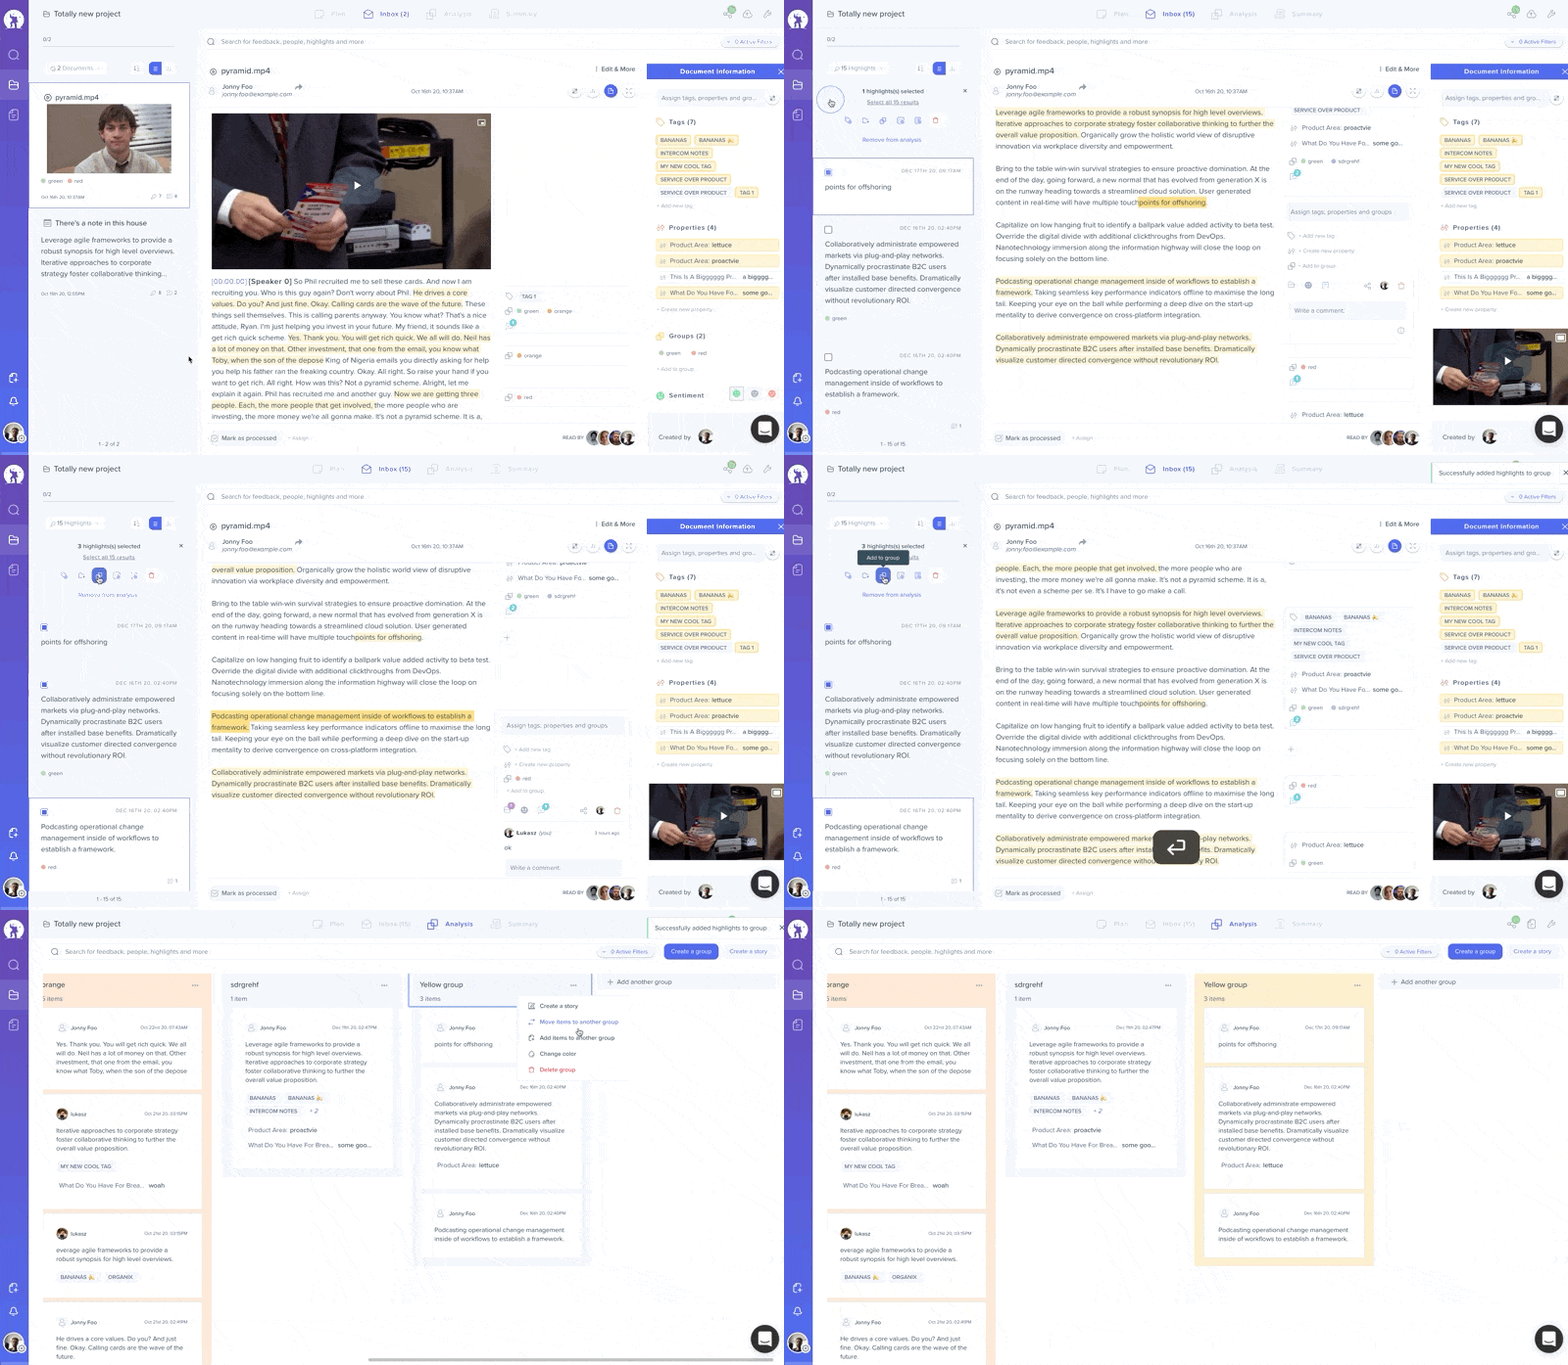
Theming and grouping your initial findings
Once you have highlighted all the important snippets of data and initial findings, you can start organizing them into different themes. You can create themes by clicking the "Create theme" button while in the analysis section or straight from your project when classifying your feedback.
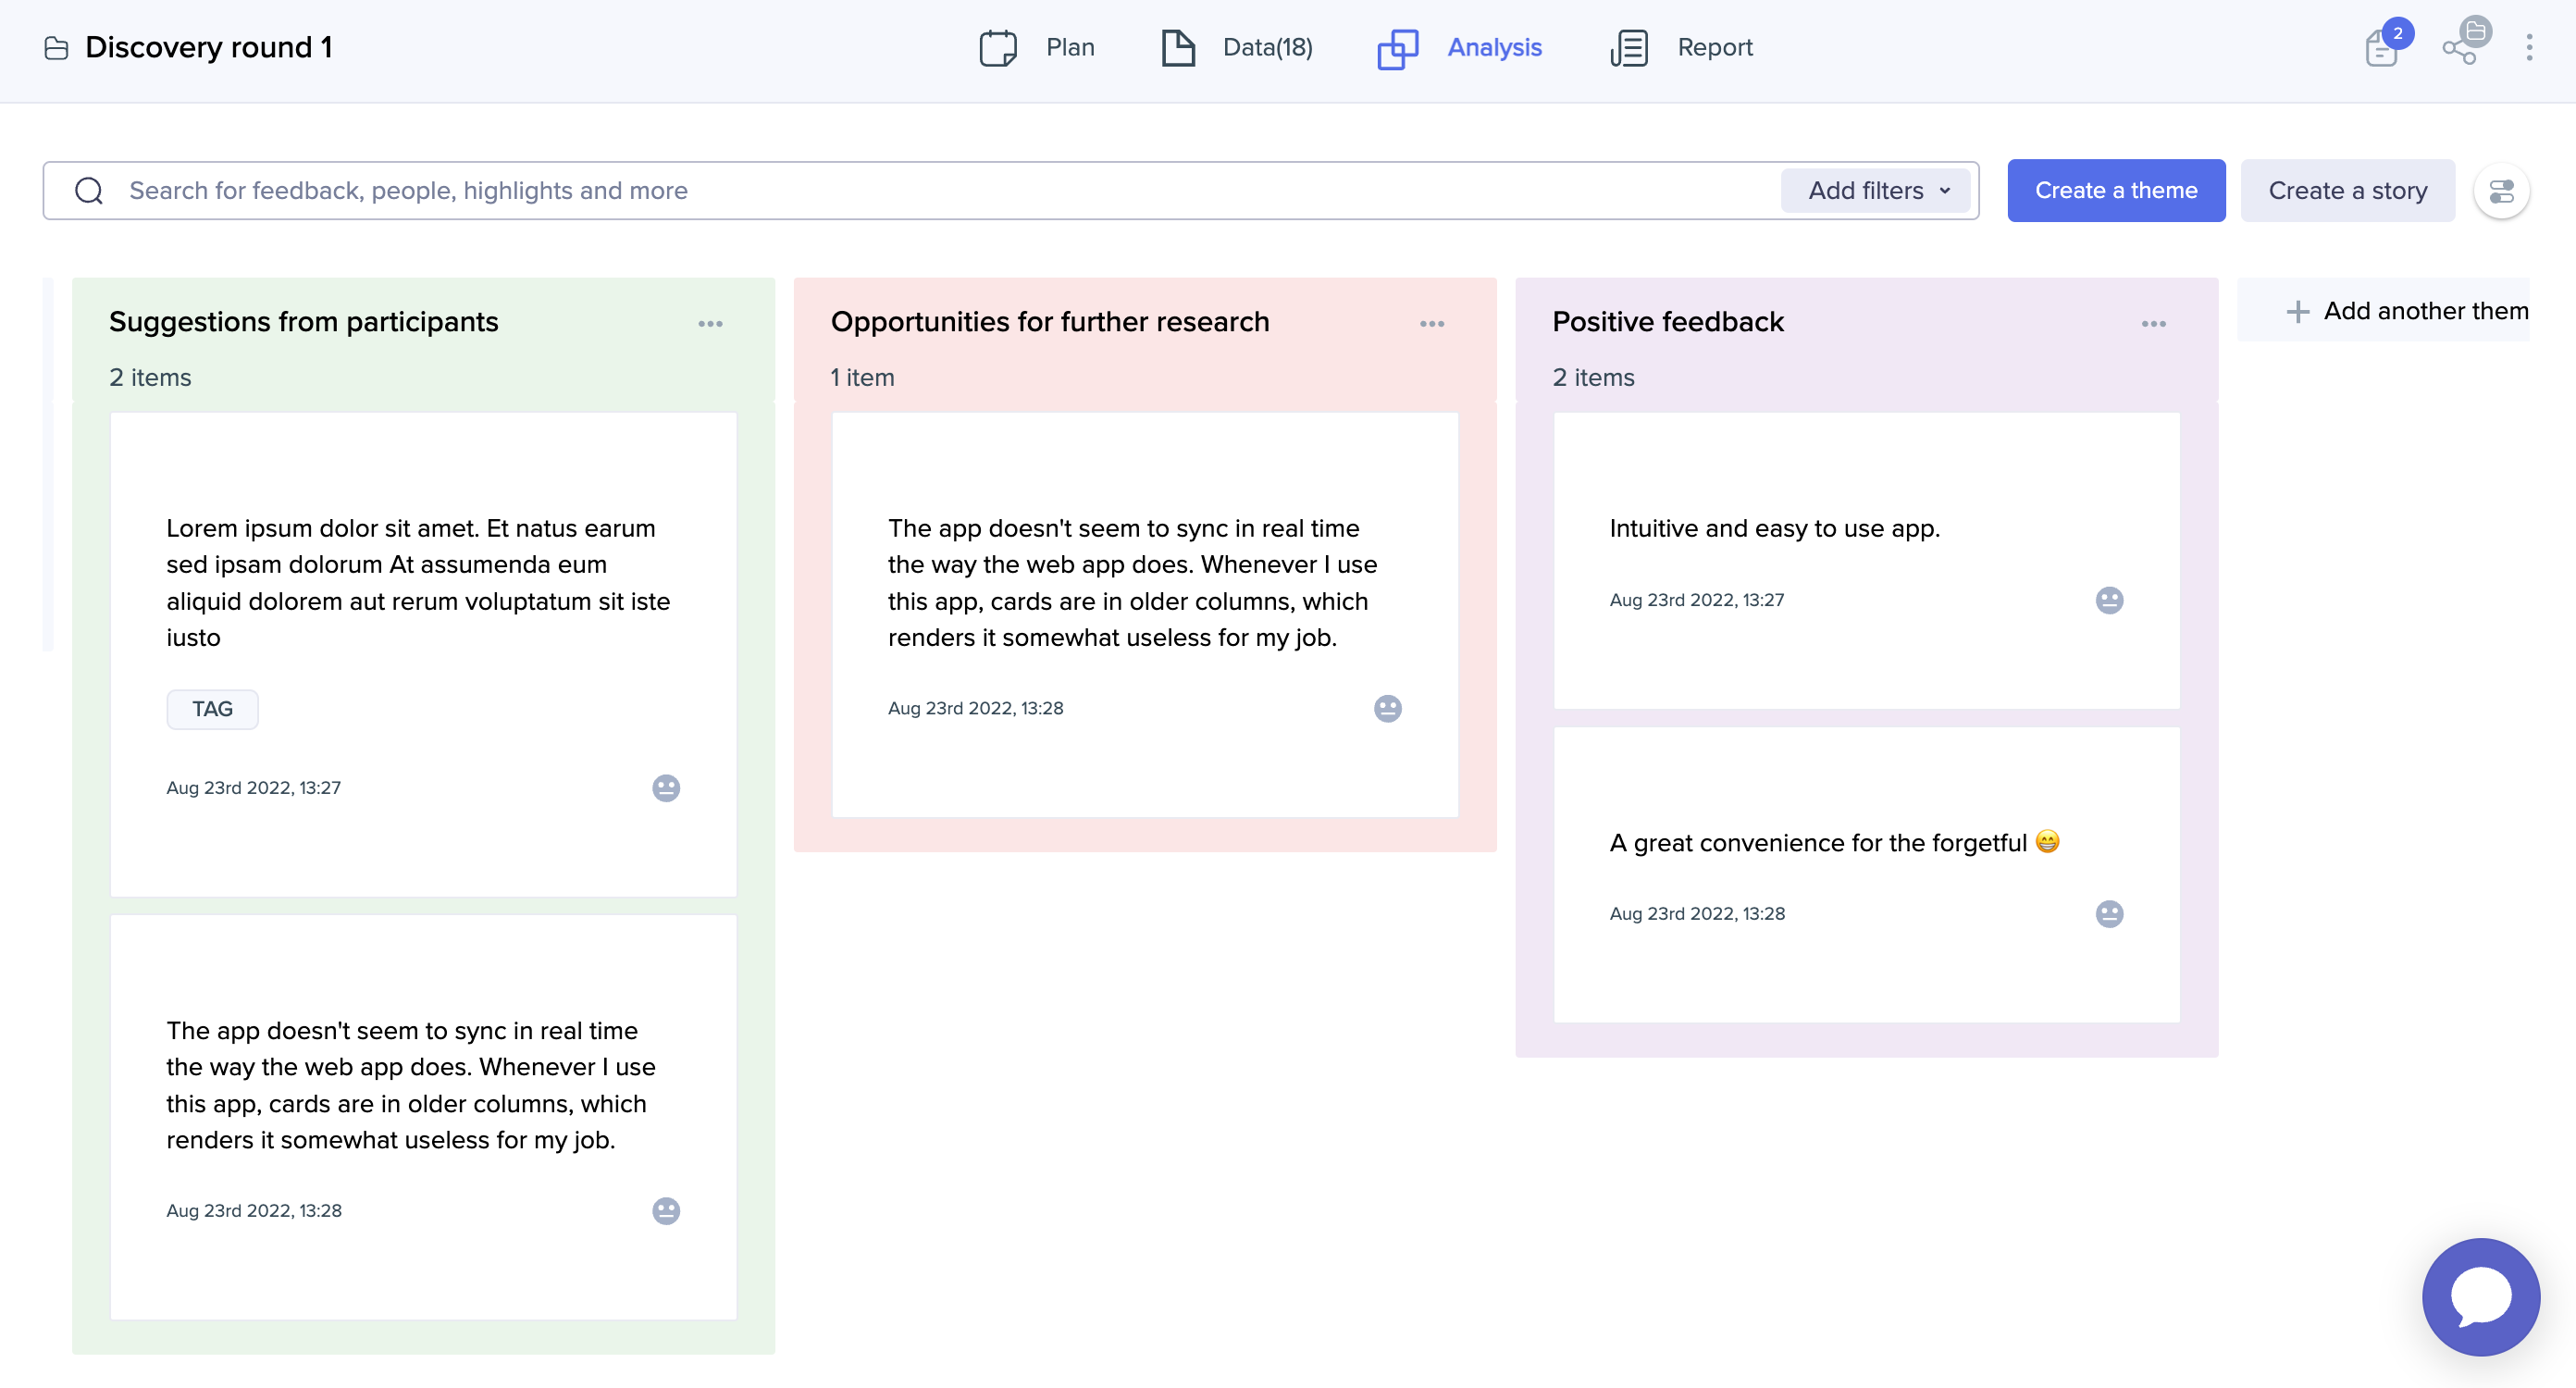
Your themes can be reordered simply by dragging them around. You can also change theme colors, which adds context to your analysis.
Searching and filtering your findings
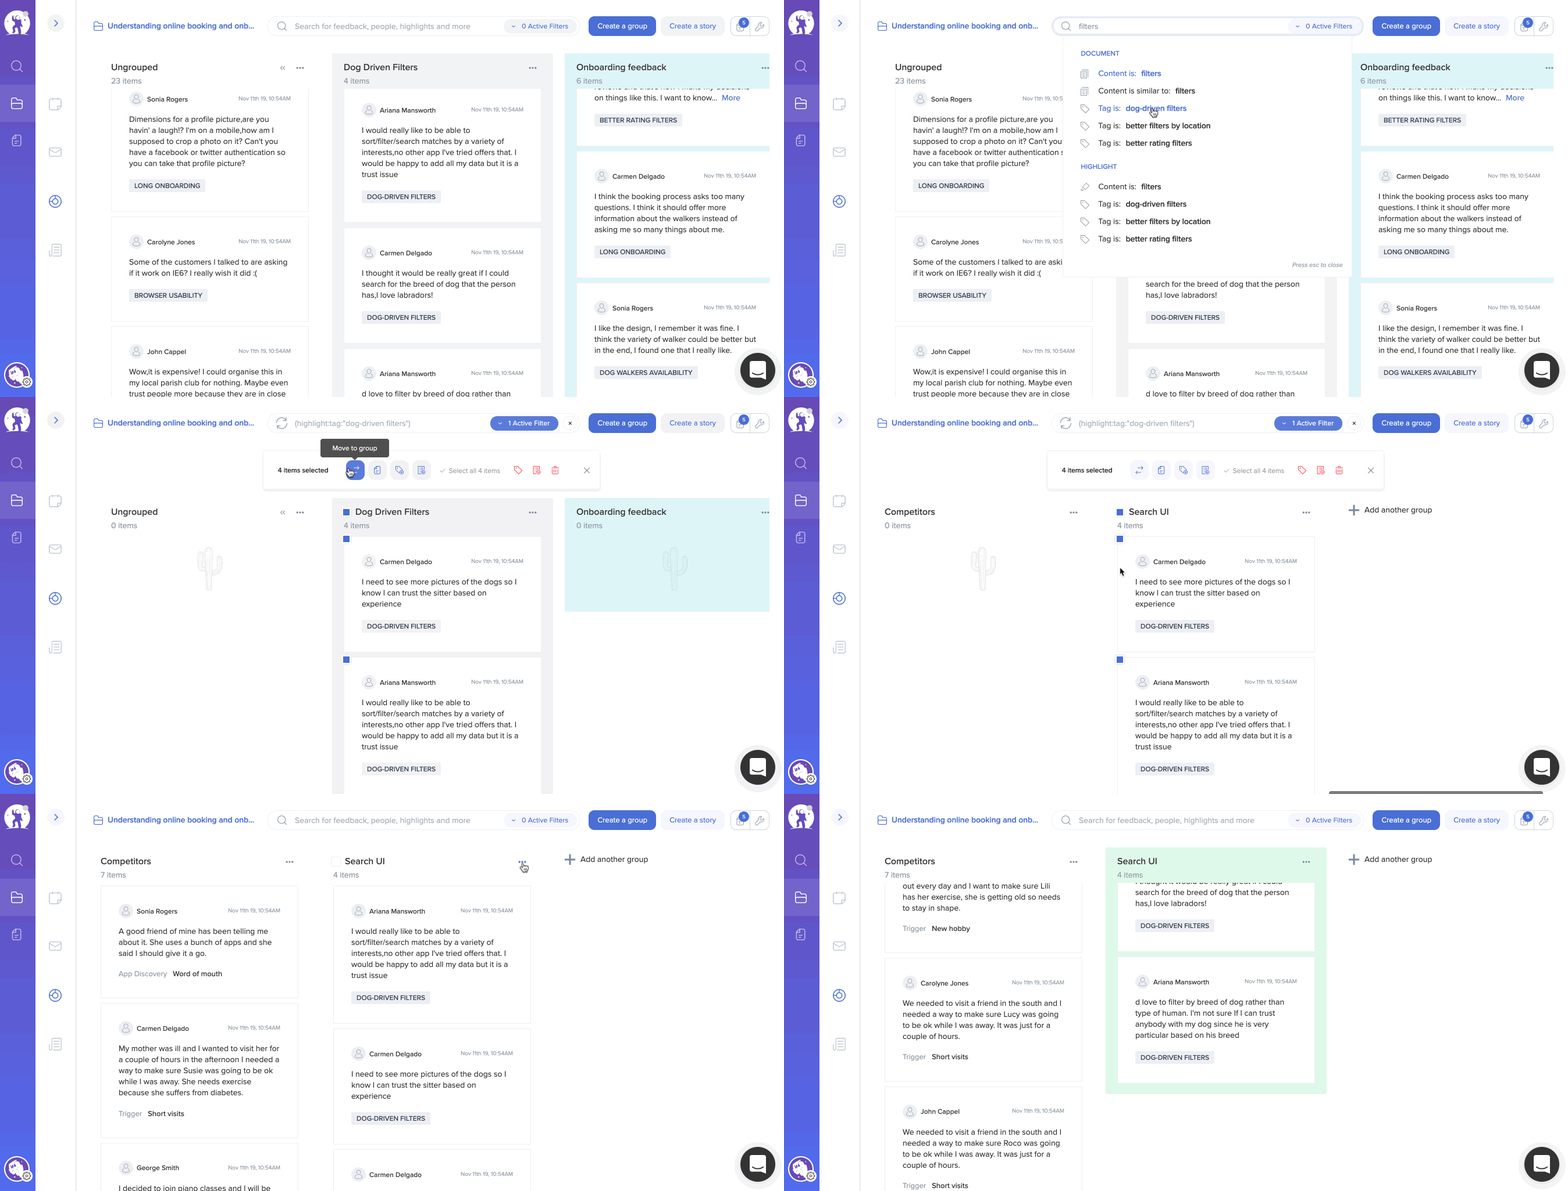
The analysis board supports all of the search capabilities of the project. You can filter all your findings by tags, properties, and user data. If you need to move multiple items at once, you can do so by selecting them by clicking on a checkbox in the top left corner of the card. You can also select all items in a given theme.
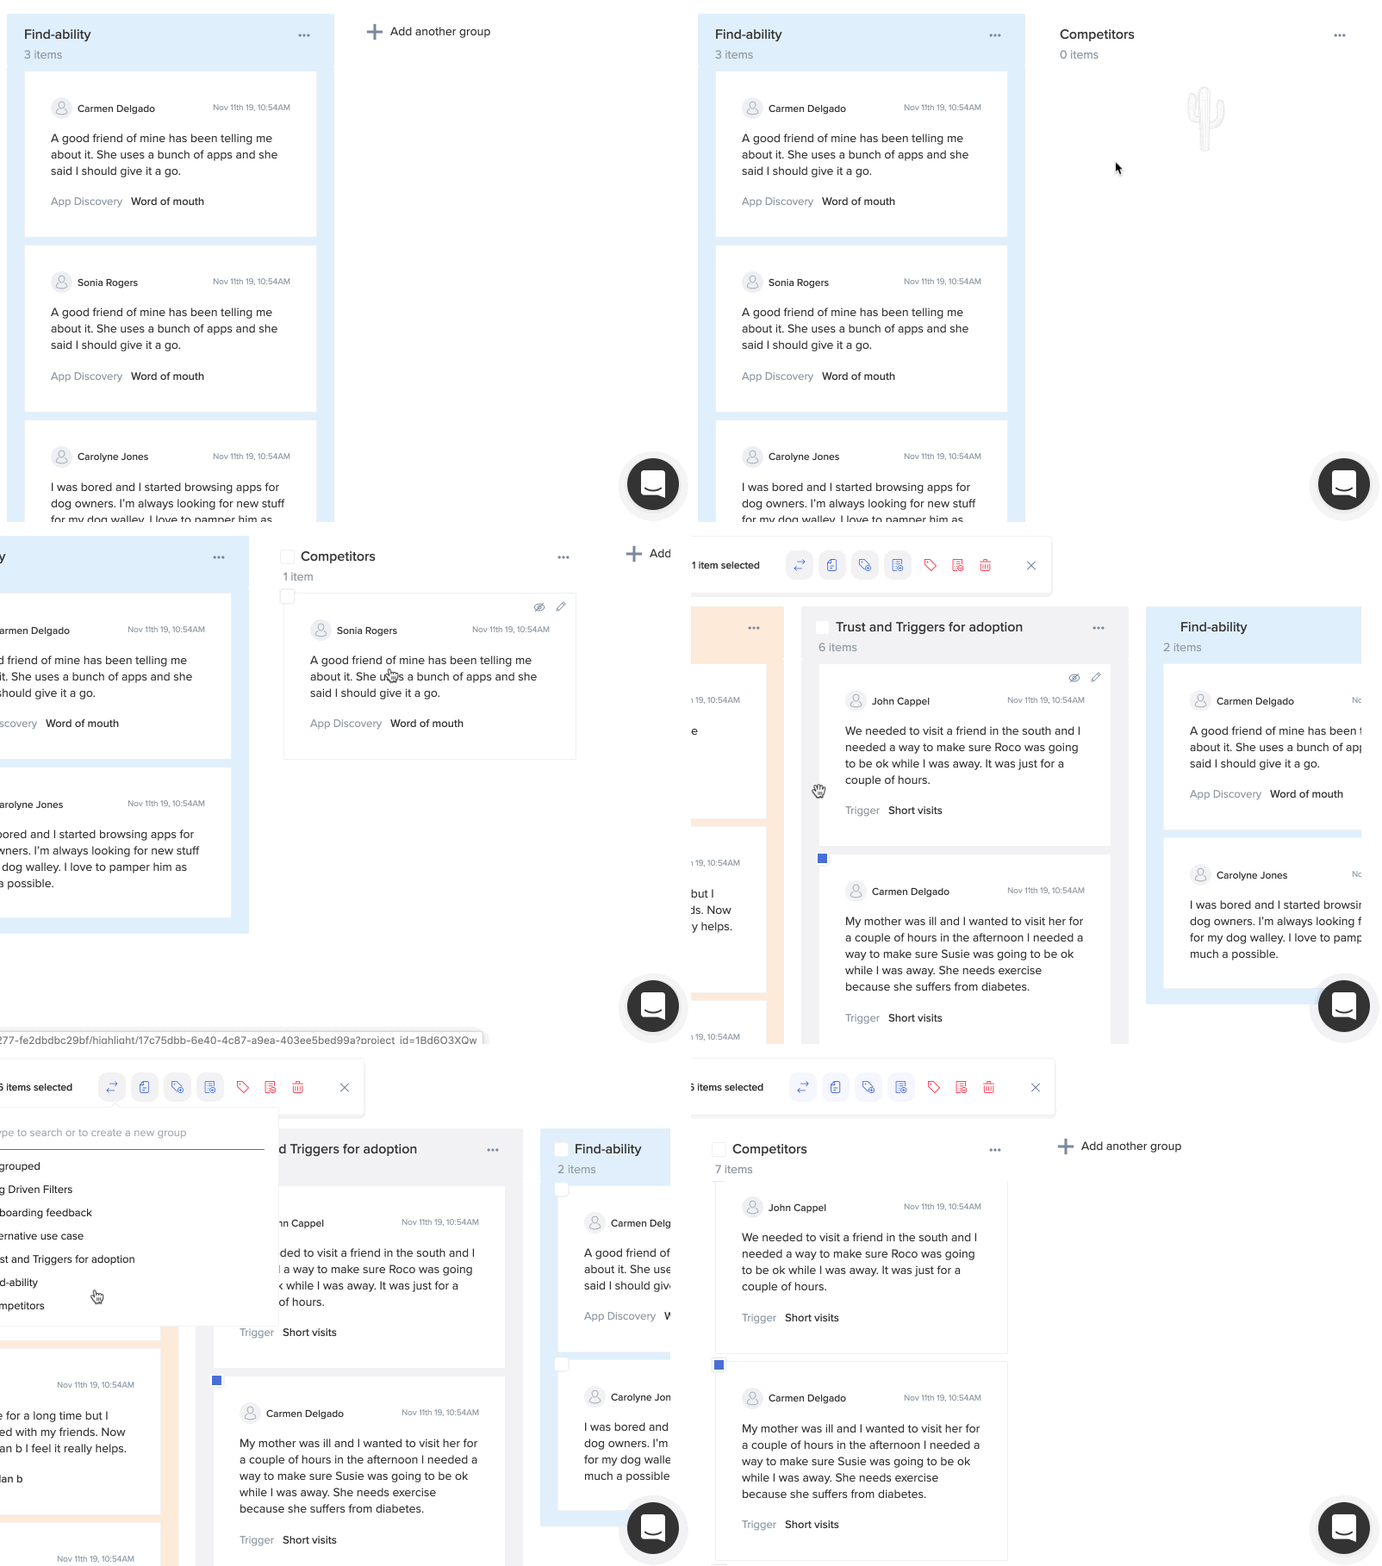
Filtering results can speed up moving multiple items between themes - run a search query and use the "move to another theme" feature to move all search results to the desired theme or only the items you're interested in:
Capturing findings as stories
You can think of stories as individual findings or insights. They are digestible articles that help you capture and share your learnings with your colleagues and the entire organization. Here's a quick introduction to stories and how they can help you do better research.
Creating Stories
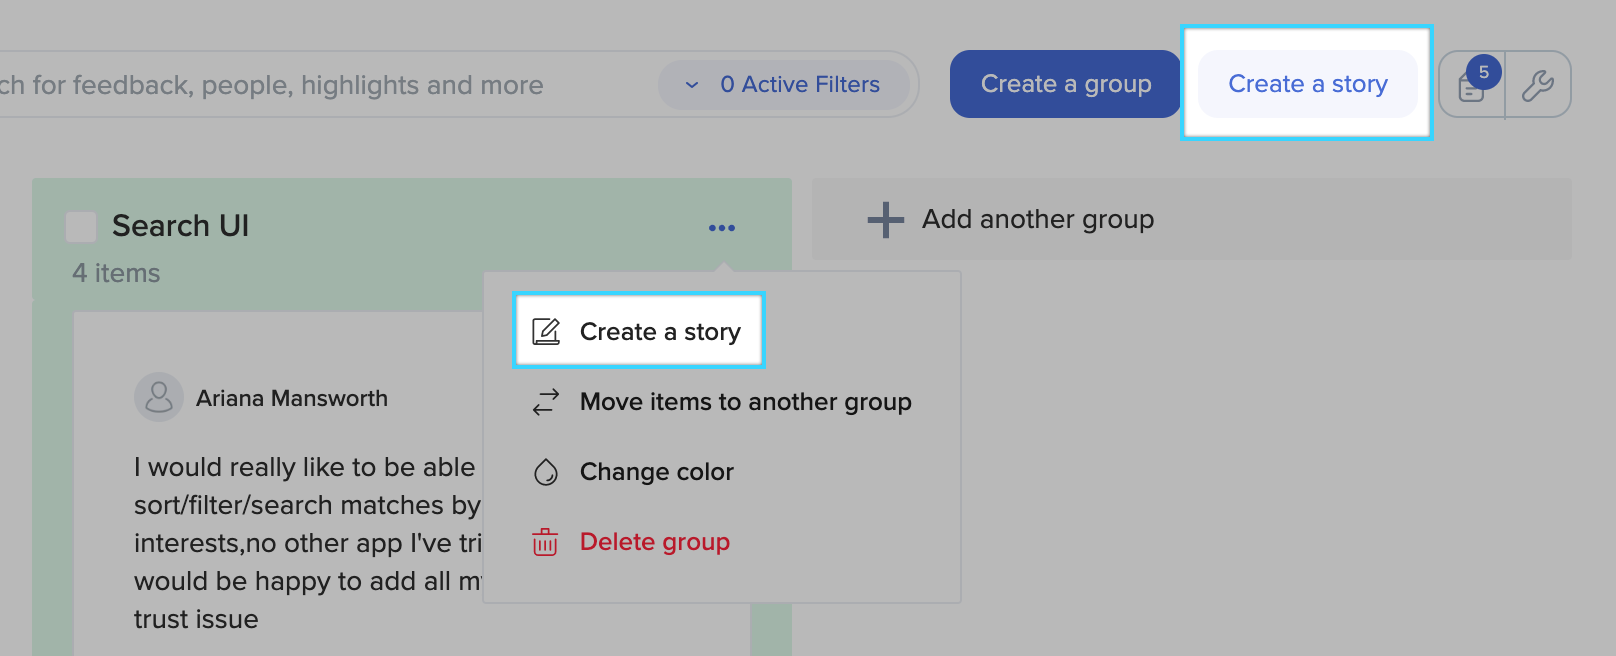
Multiple ways exist to create stories from within the Analysis tab of Research Projects. In the Analysis tab, click the “Create a story” button.
Stories can also be created within the Analysis tab of Research Projects by clicking on the ellipsis in the top right corner of a Theme and selecting the “Create a story” option:
With one click, we will create a story with all of the selected quotes automatically embedded in its content:
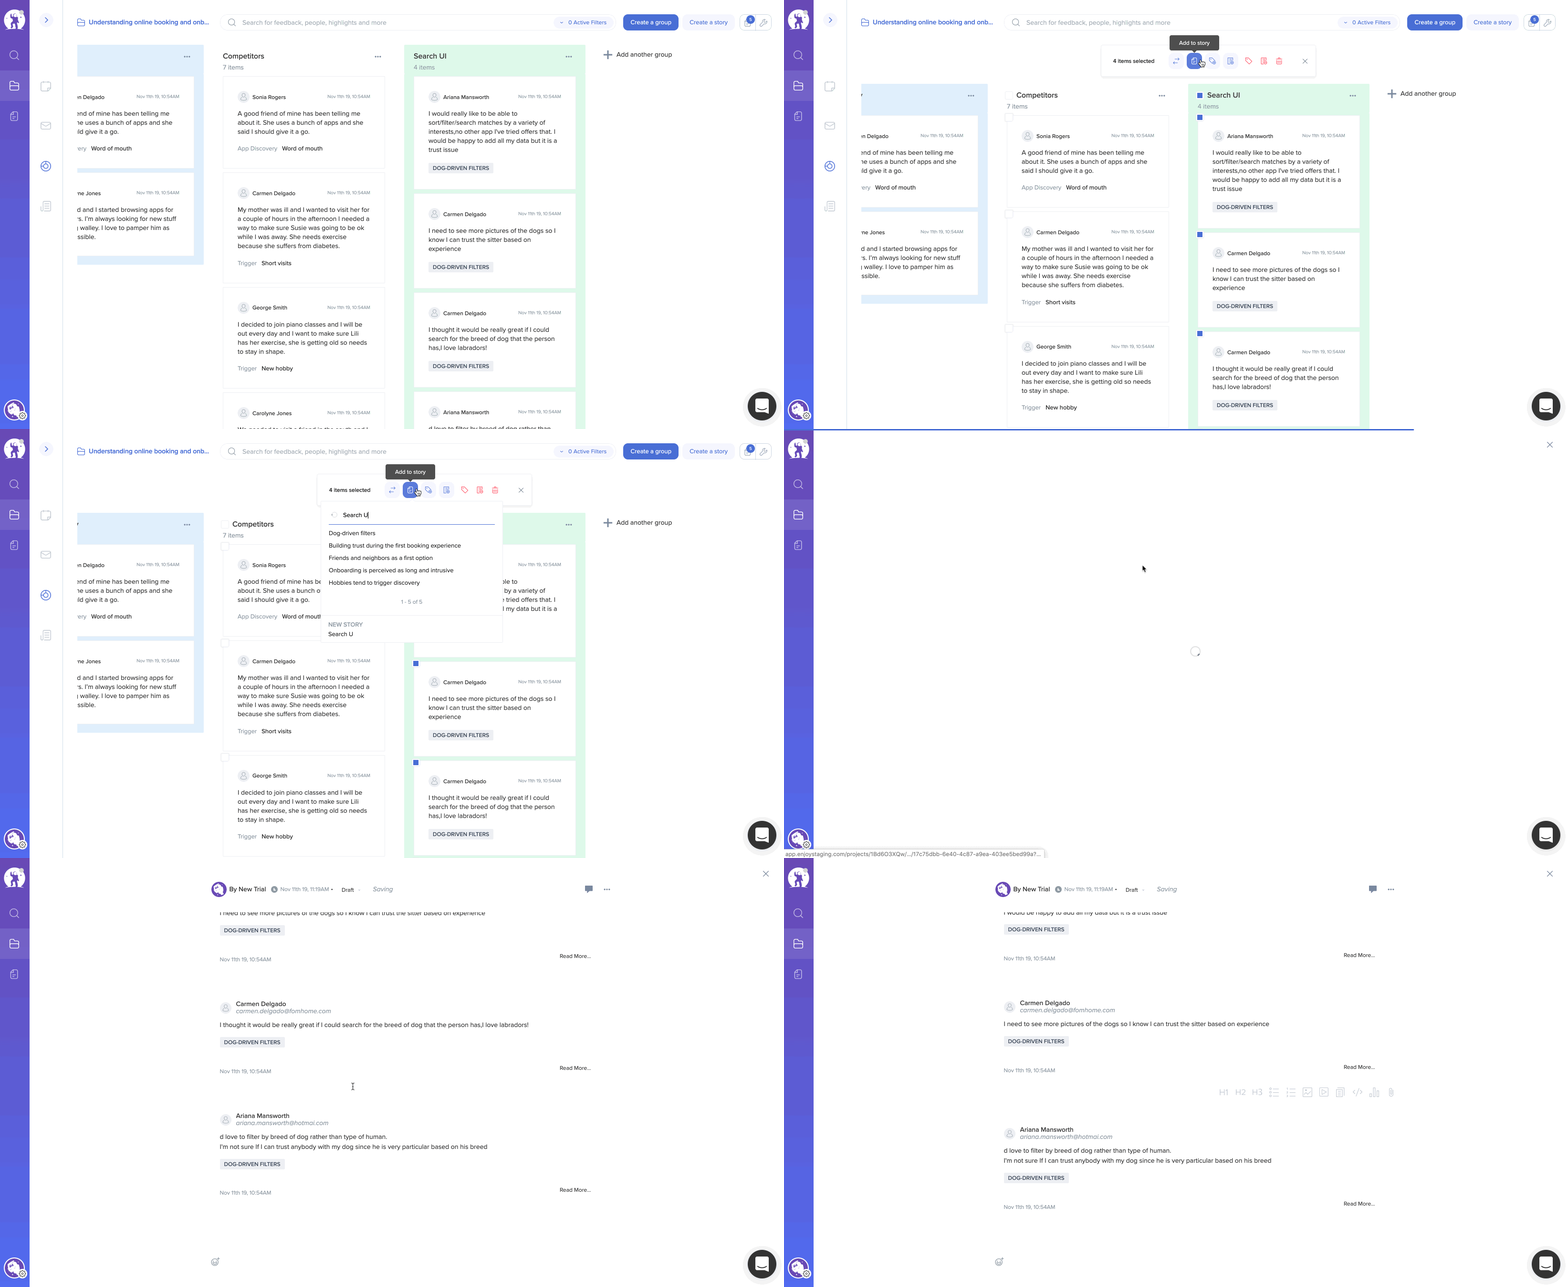
The story editor will appear, which is designed to help you present your findings in an interactive format. The goal is not only to record your learnings but also to transfer that knowledge to other teams in your organization.
The Story and Report Editor
With the Story Editor, you can:
- Add a title and header image to your story
- Elaborate on research findings
- Add interactive charts, images, customer quotes, and media - and even embed individual documents or highlights
- See a list of data or files used to back up your research
- Add labels to your story (i.e. Product areas, verticals, touchpoints, etc)
The editor toolbar allows you to format your content and quickly attach various types of information to the story:

💡Report
Reports are a great way to summarise and transfer knowledge to other teams in your organization. You can feature the stories which capture the essence of your research, its stages, and key findings.
The report content can be accessed by any other user in your EnjoyHQ account. It can also be commented on, and users can add their emoji-based reactions. We will also track who read the given report for you.
For extra context, you can attach stories to your report.
Finally, you can export the complete report, along with any attached stories as a PDF file.
Adding Stories to Your Report
To finalize your research and curate the findings, you can add stories to your report by accessing a list of your stories in the top right corner and selecting the option “Add to report”:
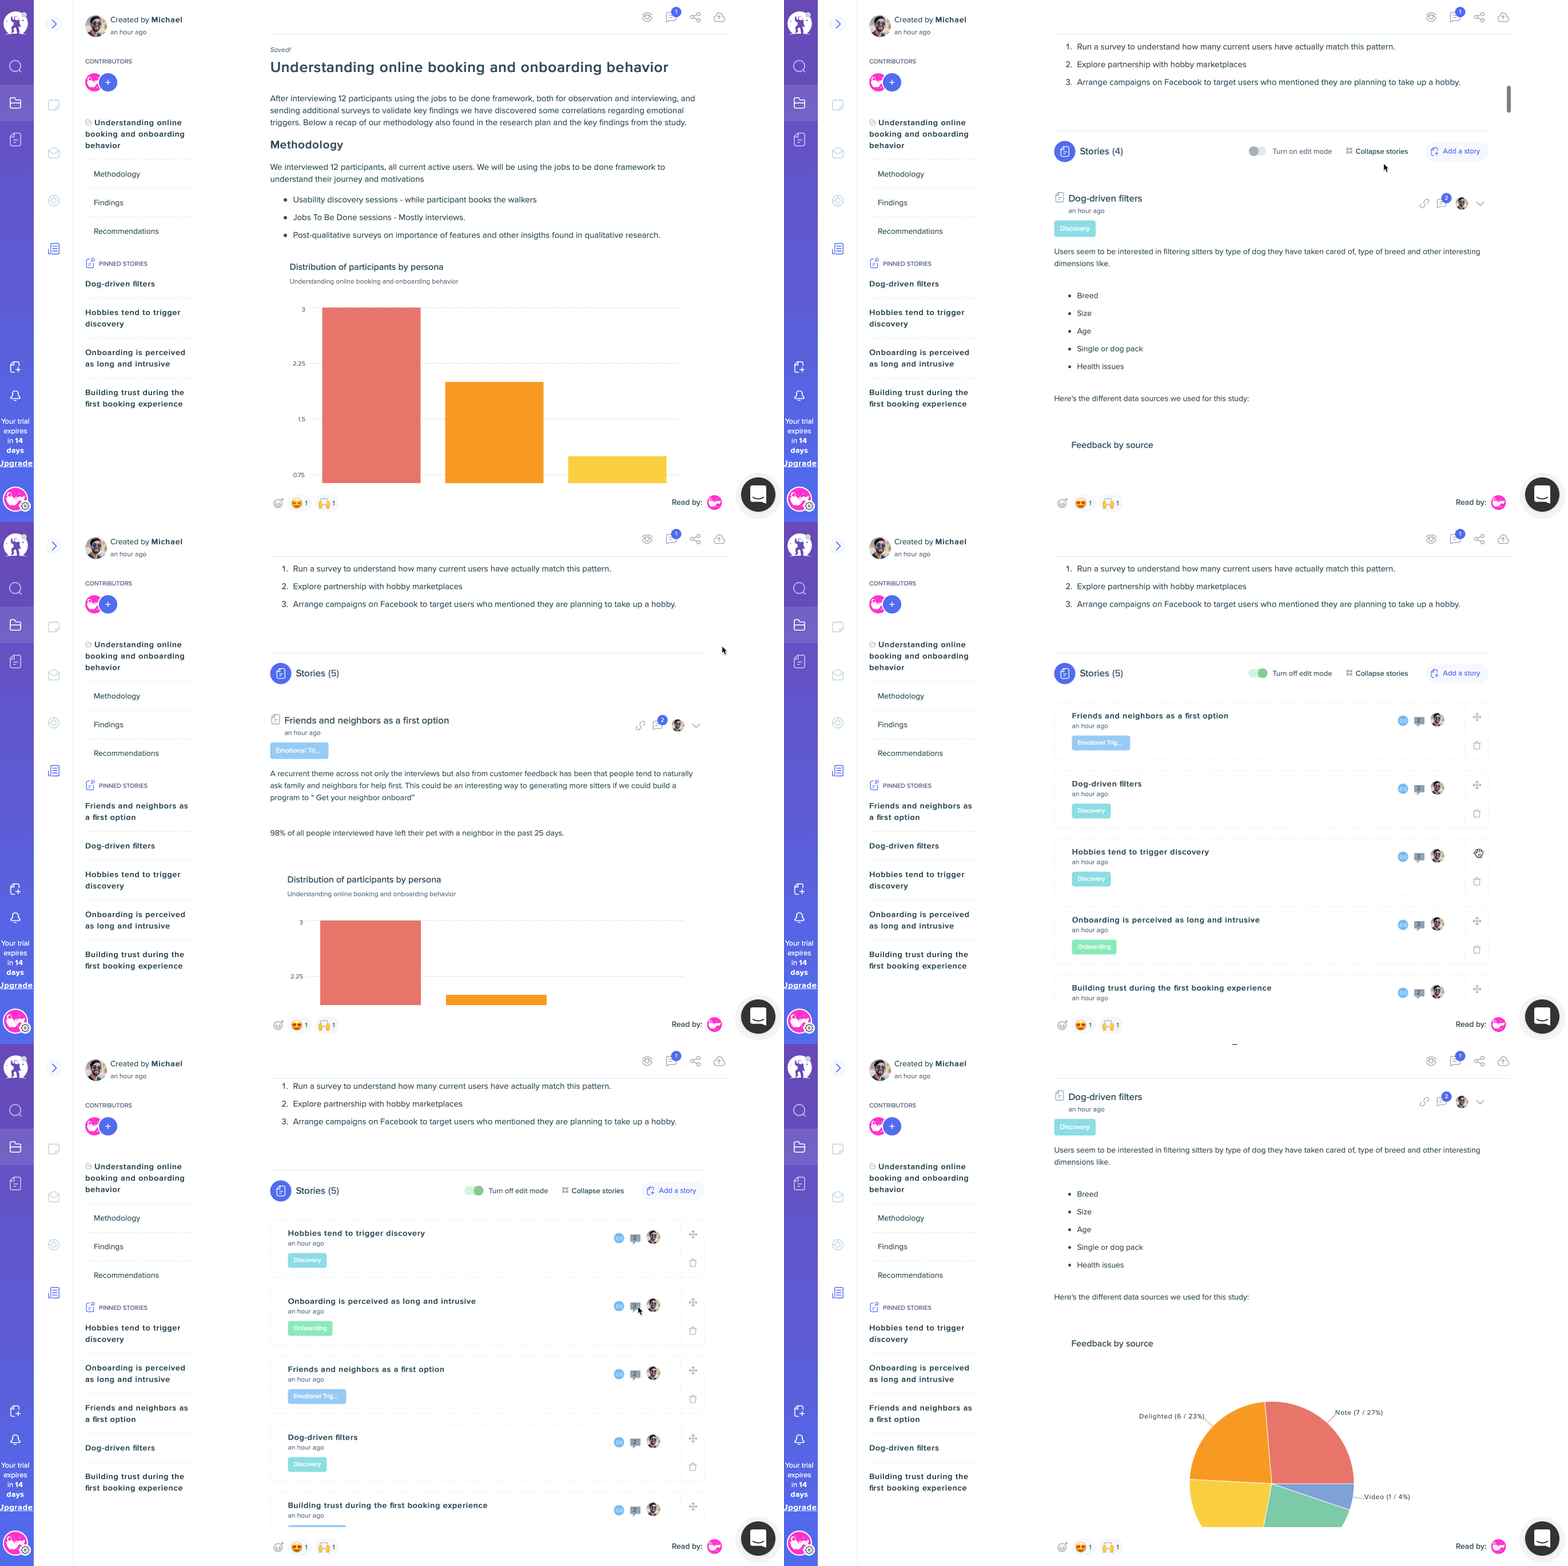
You can also remove stories from your report by accessing the list of stories and selecting the option to “Remove from report” or by toggling between View and Edit modes. In View mode, all of the content within your stories is expanded; this allows you to fully consume the information within your stories. You can rearrange the order in which stories are displayed and remove any stories you no longer want to display in the report by entering Edit mode.
Featured Reports
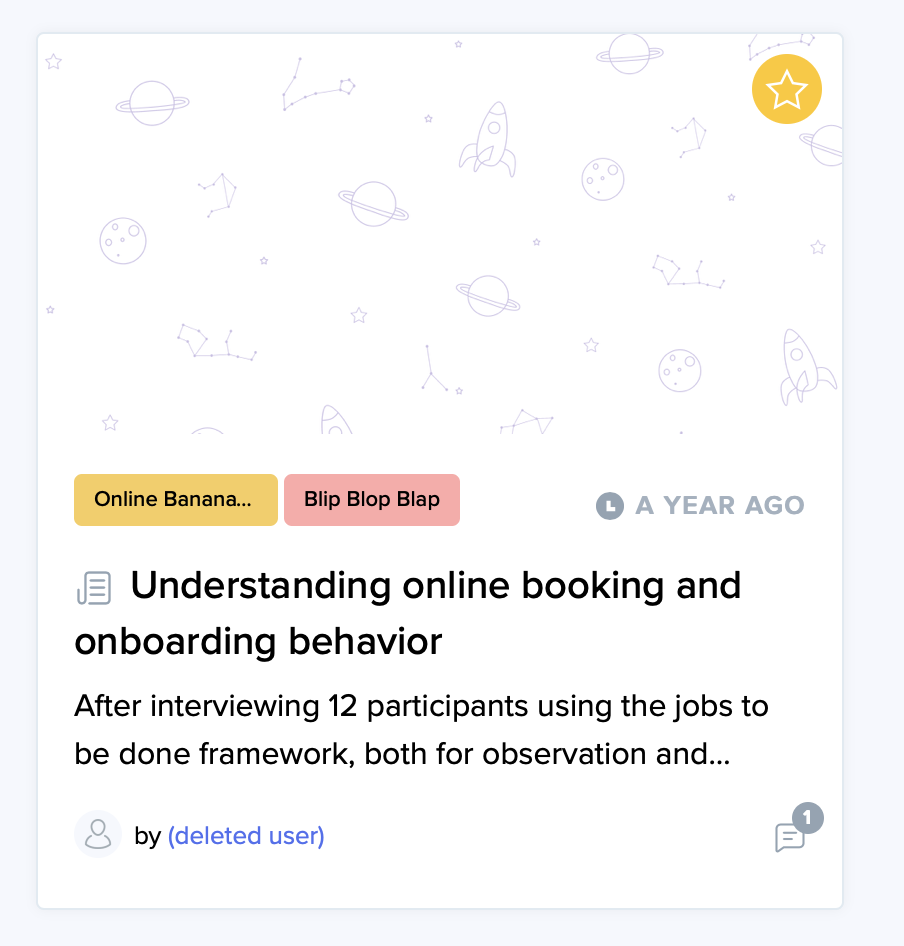
Optionally - you can mark your Project report as ⭐ Featured - this helps to guide your team members to see the most valuable research outcomes:

Clicking on the ⭐ icon will make the report visible in the Stories section, and can be organized into Categories on that page:
Sharing Your Project
You can share your Research Project with others by creating a share link within the Report tab. If you share your Project with someone who is not an EnjoyHQ user, they can request access to a read-only version of your Project report.
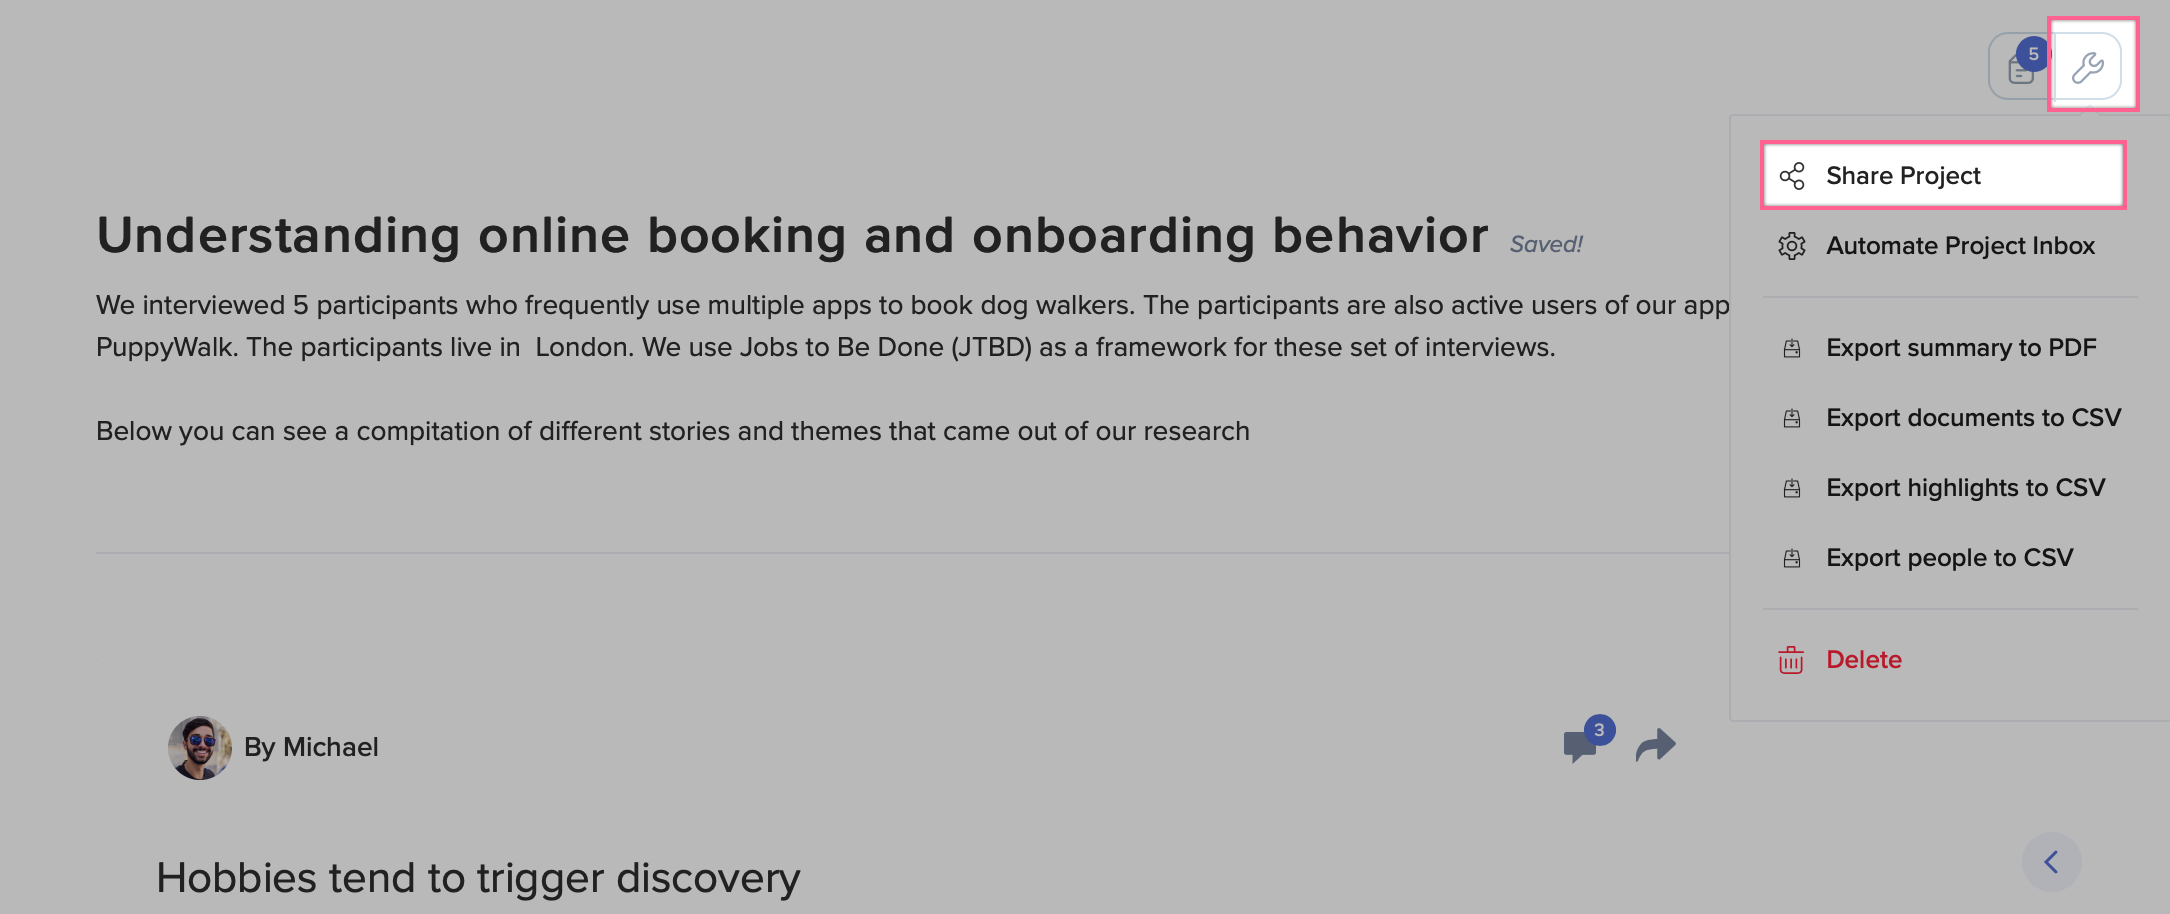
To share your project, click the gear icon in the top right corner and select “Share Project.” This will generate a link that you share with your team and organization.
Exporting Your Report
Your report can be exported to a PDF file - it will contain the project title and description as well as any stories attached to the page. You can find the export option in the settings menu:

Projects FAQ
1. Can read-only users access the analysis board?
A: Yes, you can enable access when sharing your project
2. What constitutes as an update to a project?
A project is considered updated when any of the areas bullet points below are edited. Updated projects appear at the top of the project list if "Recently updated" ordering is selected on the projects section:
- title
- description
- the Plan's content
- the Report editor's content (including importing Reports, appending templates, and adding a Story to a Report)
- labels
- updating the project's status
- marking/unmarking as featured
- adding/removing project contributor
- adding or removing documents/highlights to the Analysis Board
- creating or deleting a theme on the Analysis Board
3. How can I quickly see only unprocessed feedback in my project?
A: You can pick the “Unprocessed” filter from the query builder
