In this article you will learn everything you need to know about capturing your learnings and sharing insights with your team via Stories.
You can think of Stories as mini-blog posts that help you capture your learnings and share insights with your team and entire organization.
How Stories Fit Into The Research Process
Embedding Customer Quotes in Stories
Introducing Stories
How Stories Fit Into The Research Process
When analyzing and coding your raw data, you’ll start to identify themes and will need to capture your thoughts as you evolve your thinking and identify patterns. This is where Stories come in - think of Stories as mini-blog posts where you can add customer quotes, videos, images, reports, attachments, and other data points to your findings, making it easier for others to consume your work.
Creating Stories
Stories as part of a research project
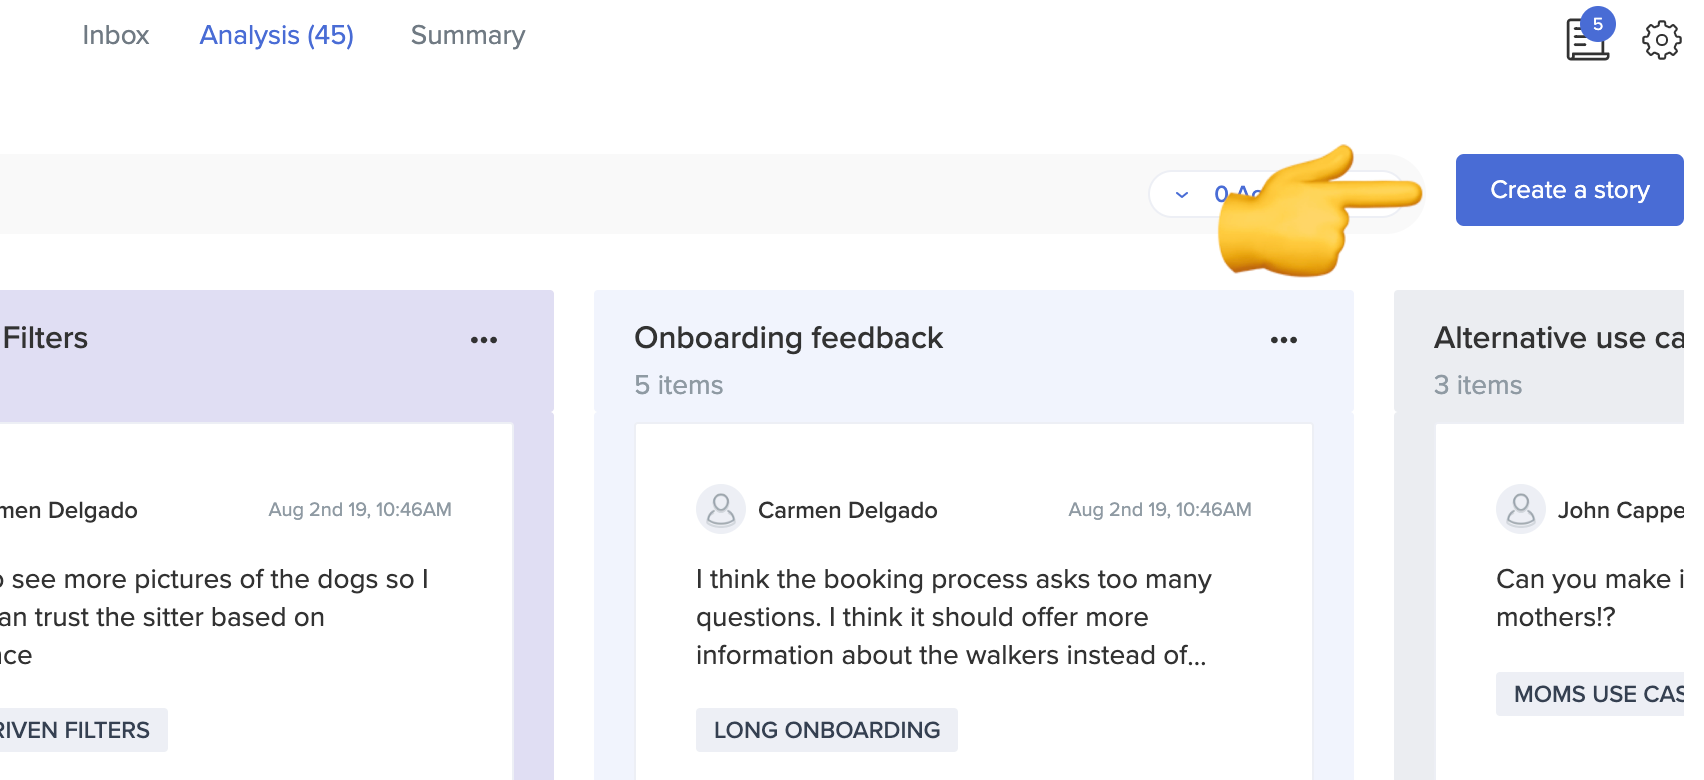
There are multiple ways to create Stories from within the Analysis tab of Research Projects. In the Analysis tab you can click the “Create a story” button:
Stories can also be created within the Analysis tab of Research Projects by clicking on the ellipsis in the top right corner of a Theme and selecting “Create a Story”:
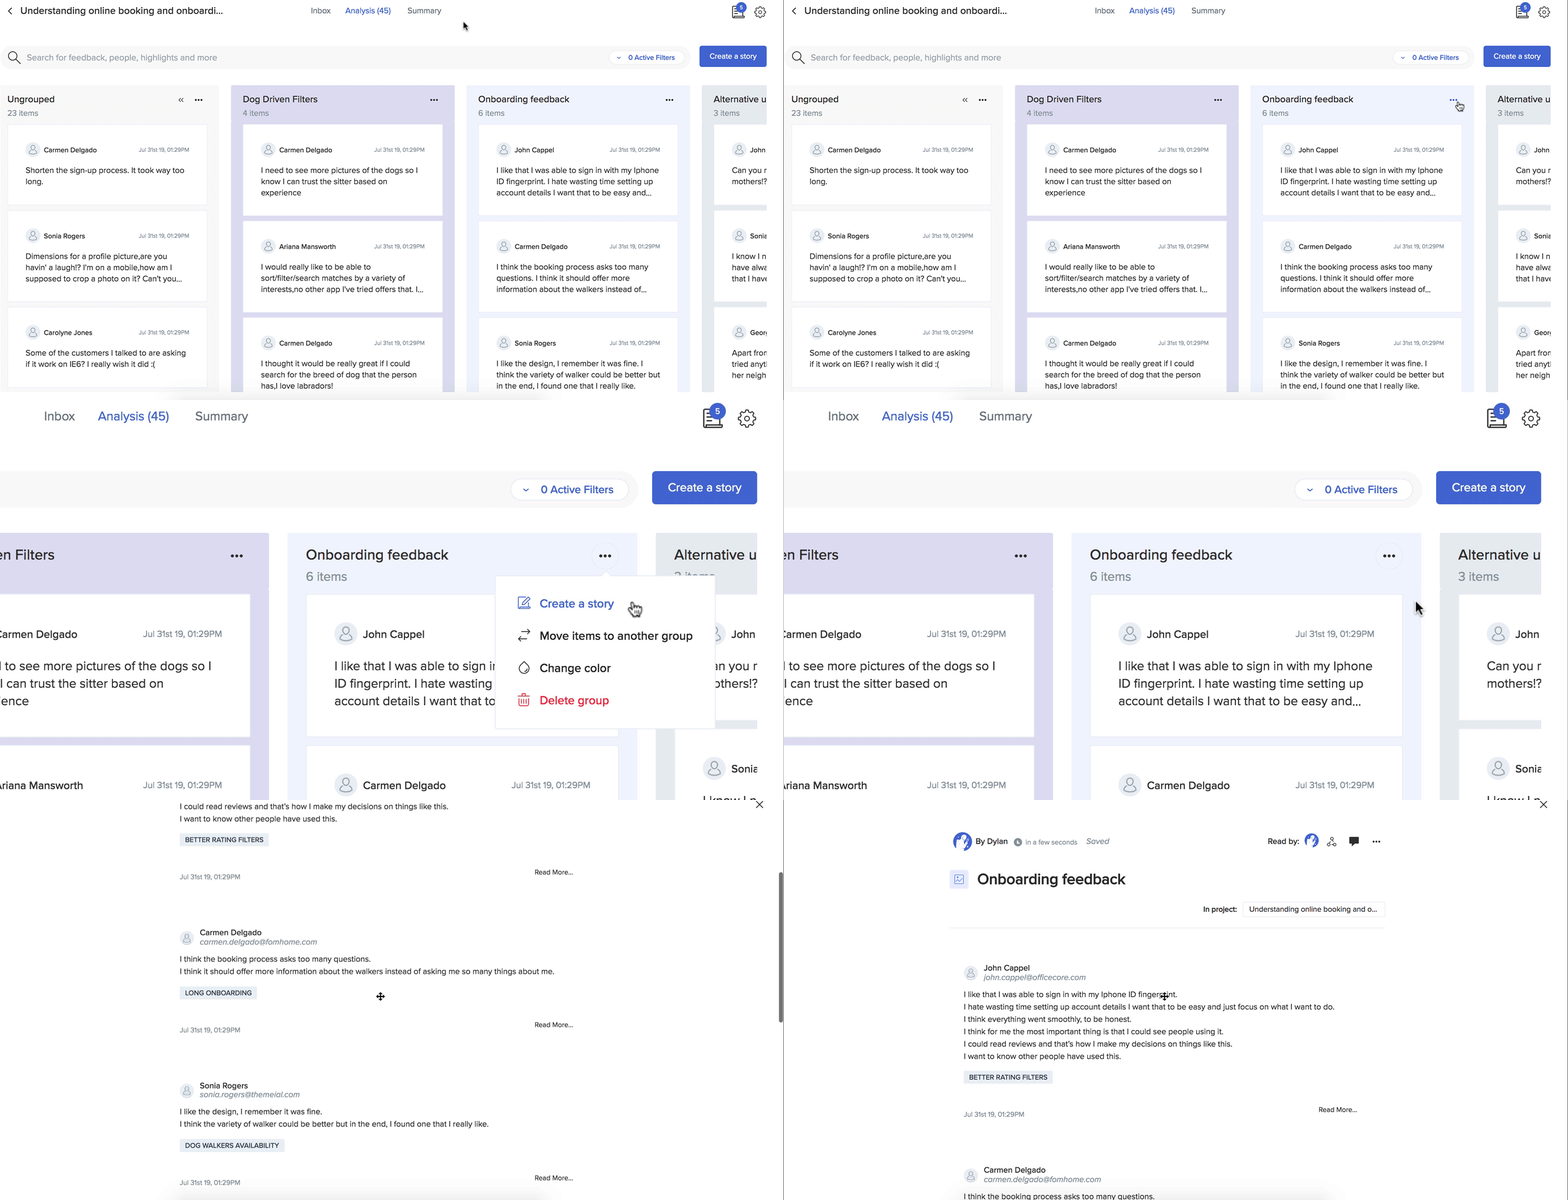
The Story Editor will appear, which is designed to help you present your findings in an interactive format. The goal is not only to record your learning but also to transfer that knowledge to other teams in your organization.
The Story Editor
With the Story Editor, you can:
- Add a title and header image to your Story
- Elaborate on research findings
- Add interactive reports, images, customer quotes, and media
- See a list of data or files used to back up your research
- Add labels to your Story (i.e.product areas, verticals, touchpoints, etc)
The editor toolbar allows you to quickly embed various types of information in the Story:

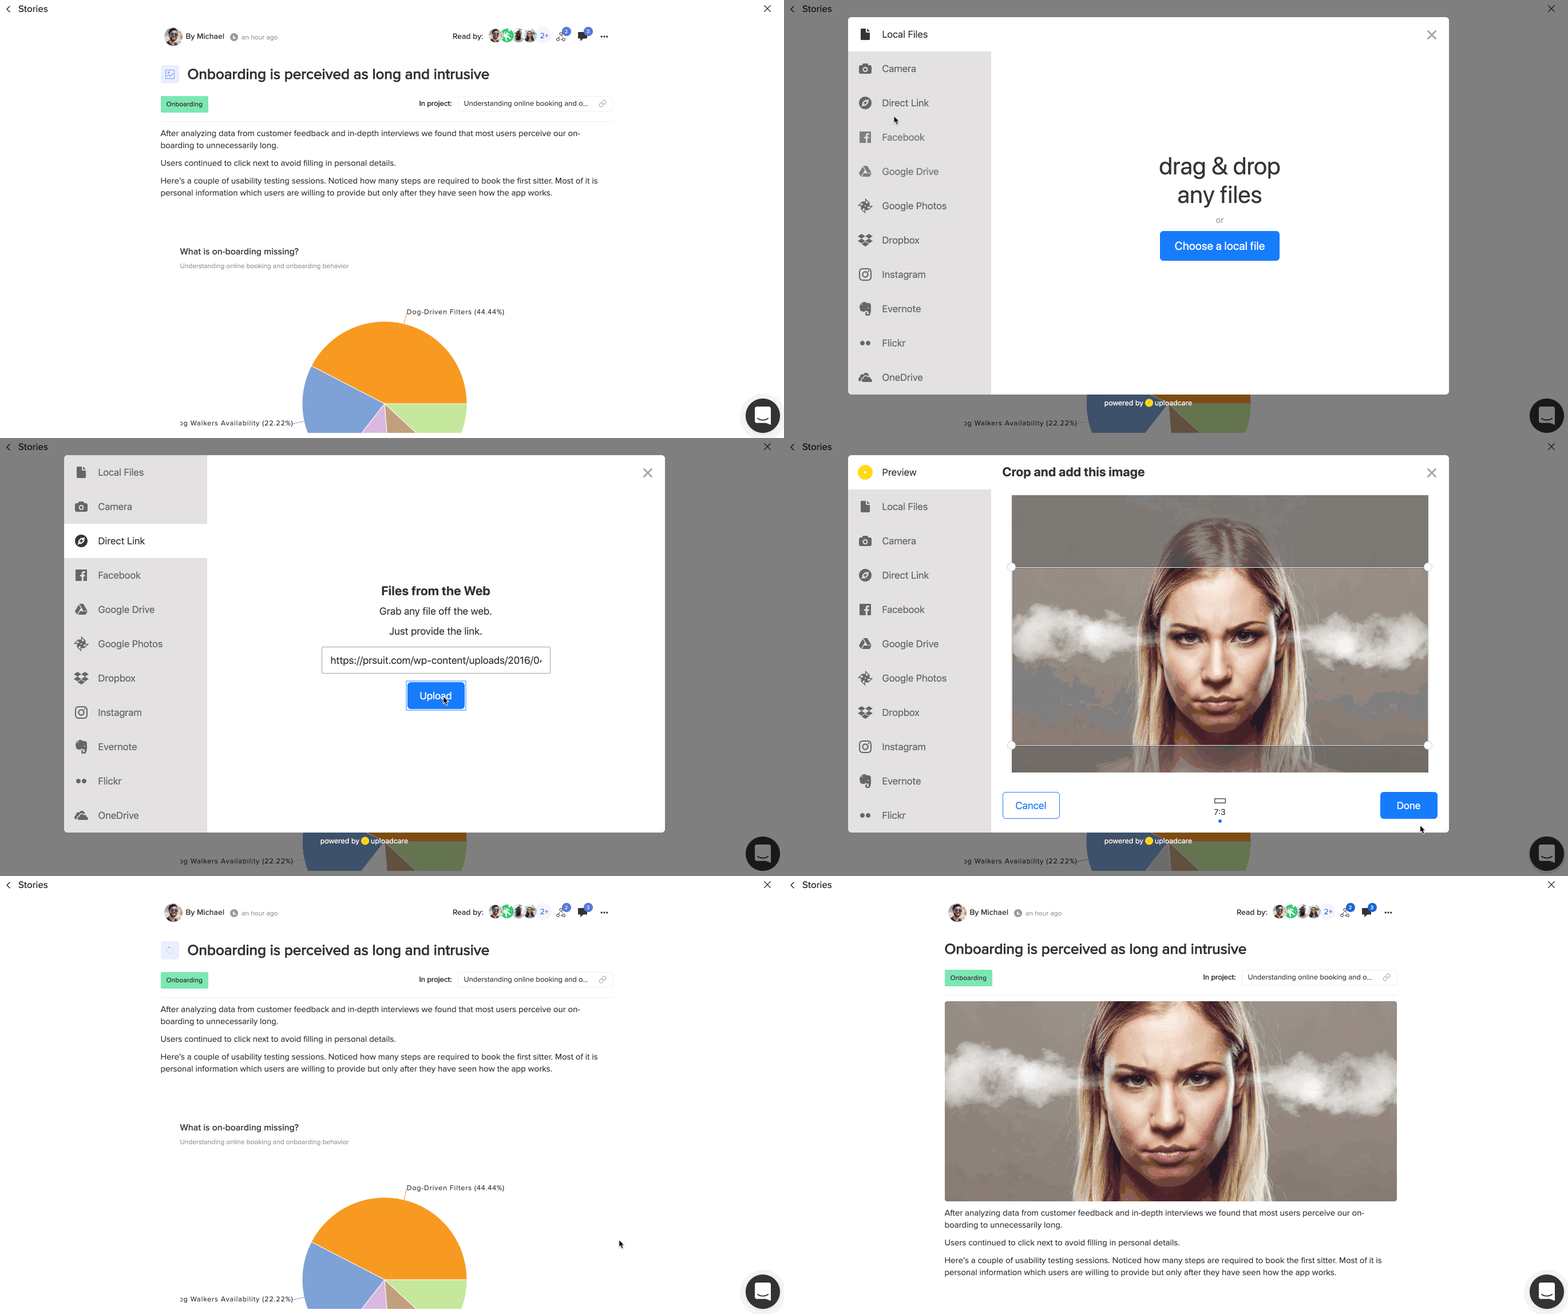
Attaching header images to Stories can help you organize findings and create visual connections to research findings - click on the image icon next to the Story title and upload or attach your preferred image:
Embedding Customer Quotes in Stories
The Story editor can embed individual highlights or even whole documents (notes, support tickets) in the Story content:

When selected, you'll be presented with a list of all documents and highlights in your account. If you're editing the story in a project, it will also show a list of all insights found in the analysis board.
Once you select one or more quotes to embed, you can configure the visibility of:
- Customer details (name and email) (if connected to the item you're embedding)
- The date
- Classification options (tags and properties)
- "Read more" link - this option affects only read-only users.
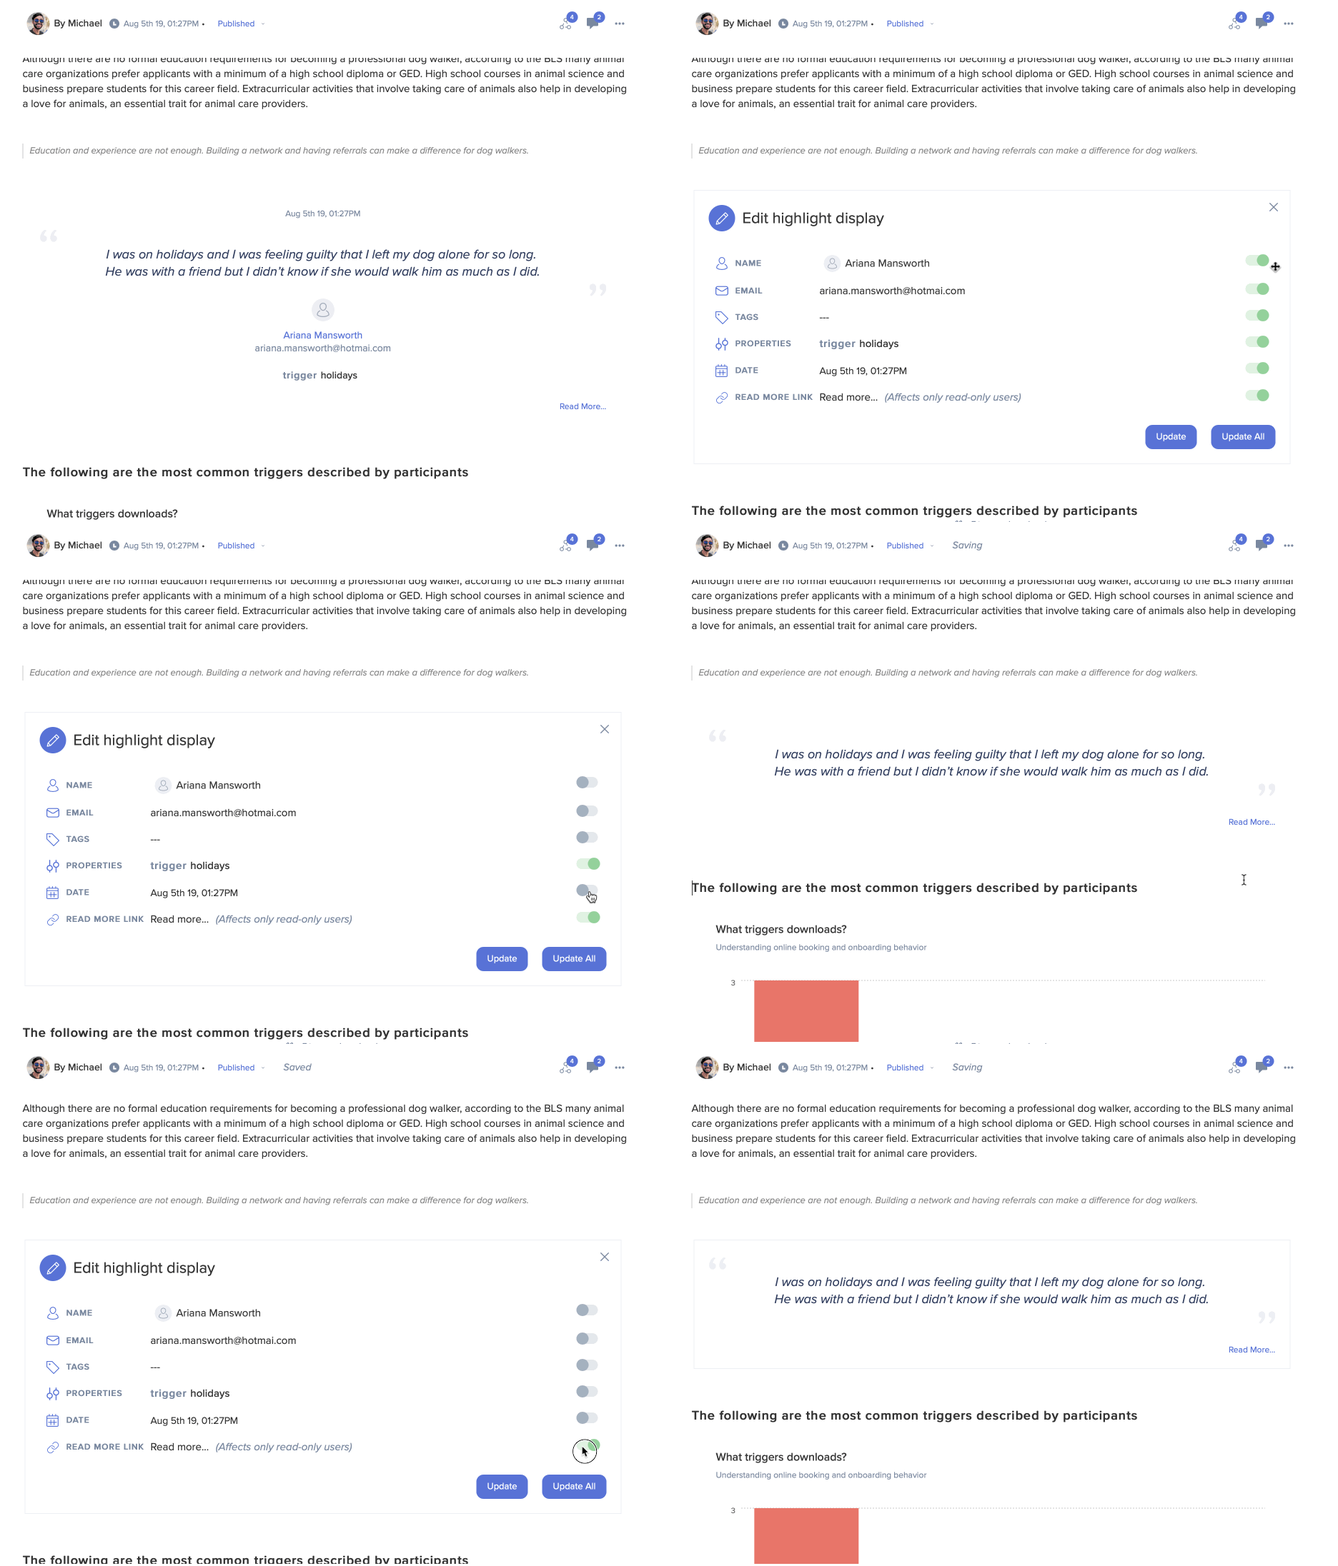
These settings can be applied to all embedded quotes in the story or only the current one.
Stories (and Project Reports) can stand out by marking them as featured research. This can be done by clicking on the ⭐icon in the Story editor:

The Stories List
The Stories section can be filtered in numerous ways, including story state, labels, creator and story contents.
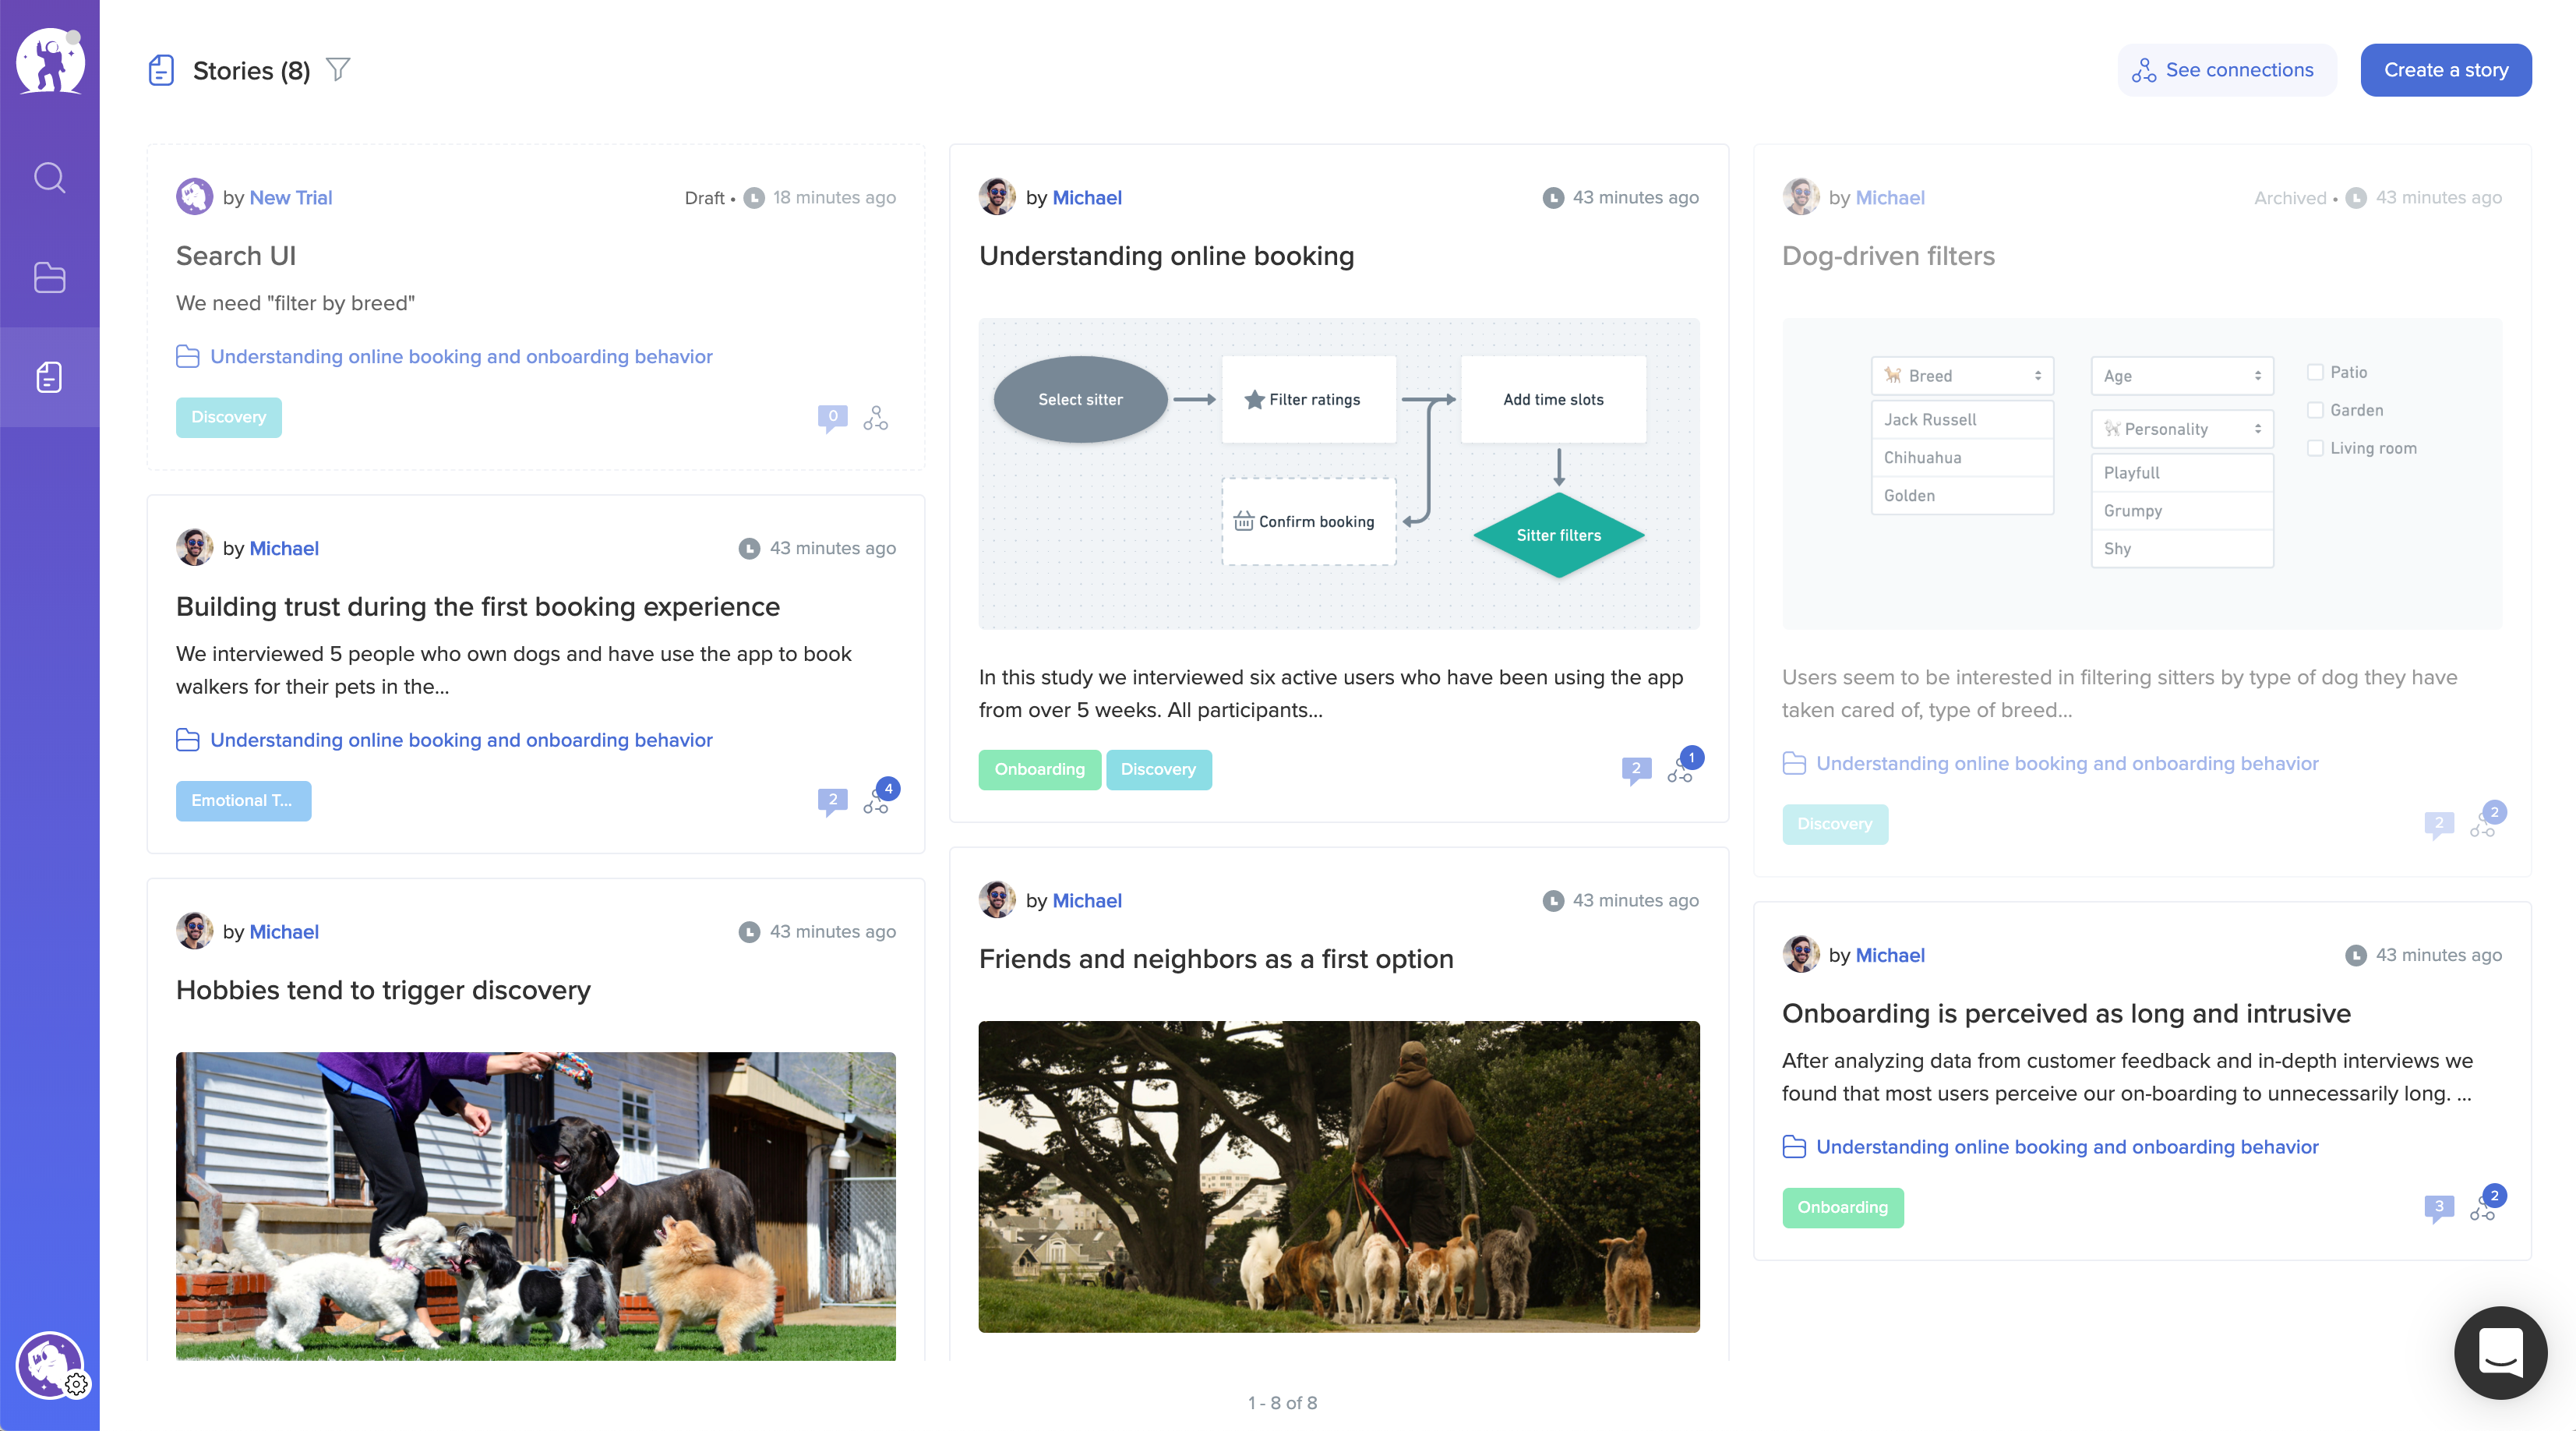
By default, the Stories list will show featured Stories and Reports first, followed by the rest of your findings. You can change the order, as well as filter the list by:
- type (stories, project reports)
- label
- author
- creation date
- state of the story (published, archived, or draft)
- content of the story
Categories
For extra curation, you can save Story list filters and give them a name - any available filter can be saved and accessed by anyone:
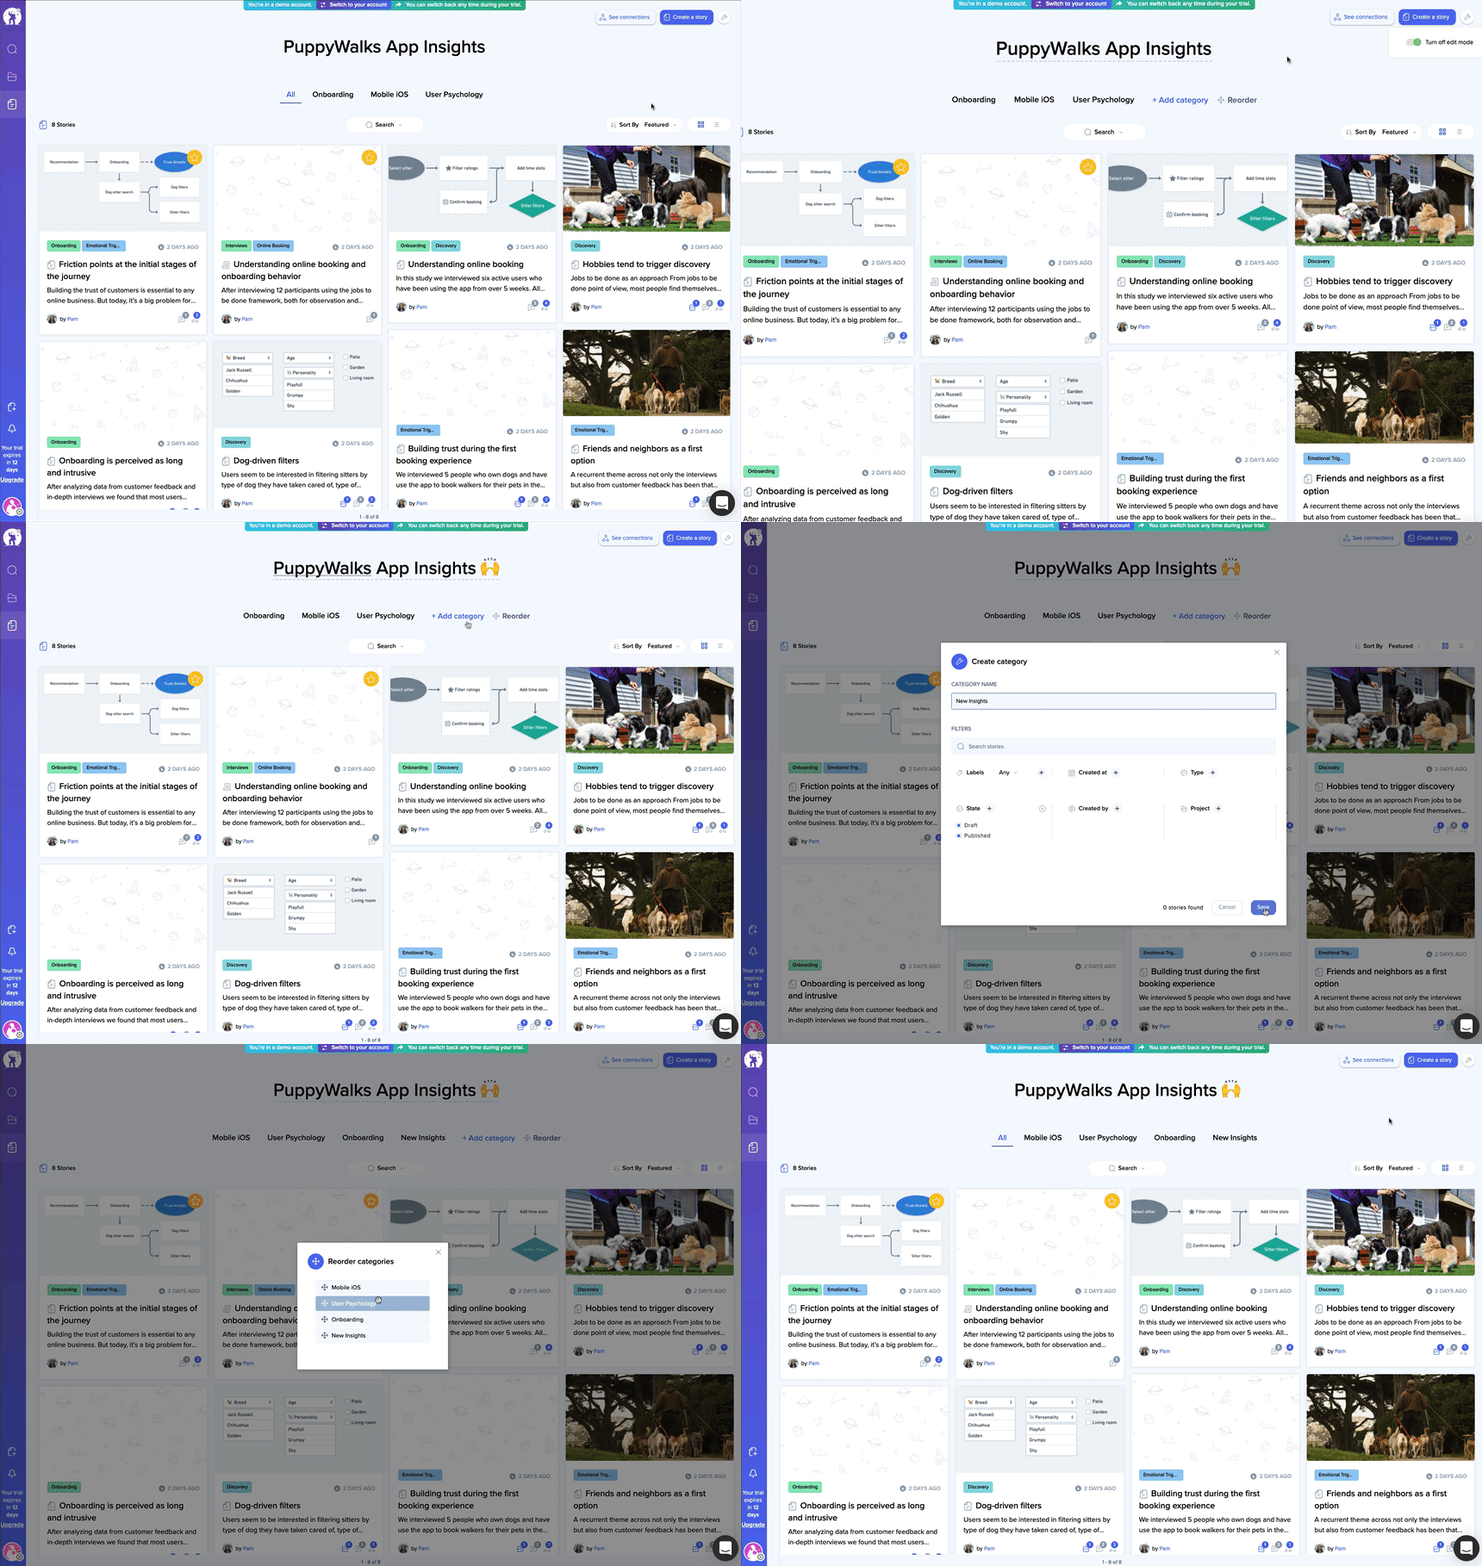
Learn more about Categories and organizing your Stories page.
Story States
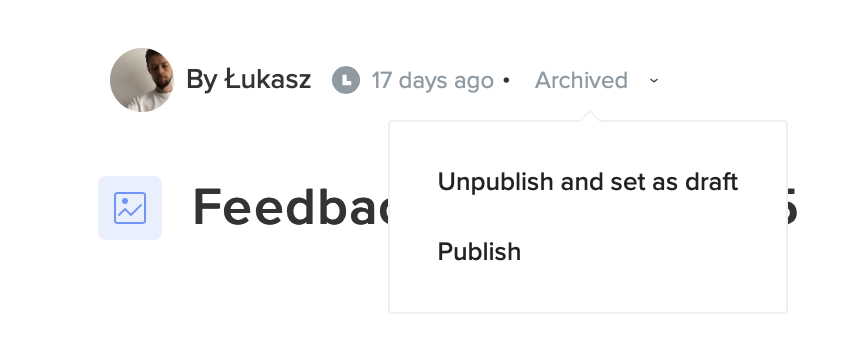
Stories can be in one of the following states:
- Draft - default for new Stories. Drafts cannot be shared with read-only users, connected to other Stories, and added to the Project's report
- Published - published Stories can be shared, viewed, and commented on by anybody, as well as connected to other Stories and be part of a Project report
- Archived - they behave just like published Stories, but are by default filtered out in the list in the Stories section. Use this state to mark your stories as outdated or not relevant to current research
Turning archived or published Story into a draft will remove it from the project's report (if it's a part of one) and also remove all of its connections!
Standalone Stories
In addition to creating Stories within Research Projects, you can also create standalone Stories from the Stories section in EnjoyHQ. Standalone Stories are essentially a blank canvas that allows you to add any context and data points necessary to explain your work. Standalone stories can also be added to existing projects or moved between projects after creation.
To create a new standalone Story, click on the “Create a story” button in the top right corner of the screen. A new window will appear, bringing up the Story editor, which allows you to give your Story a title, add labels, and attach written or video content, images, and other data points to the Story to provide context for those consuming your work.
Connecting Stories
Over time you’ll accumulate numerous valuable research findings. Making connections between your findings will not only make it easier for others to accumulate customer knowledge but also give you an idea of any knowledge gaps in your user research practice.
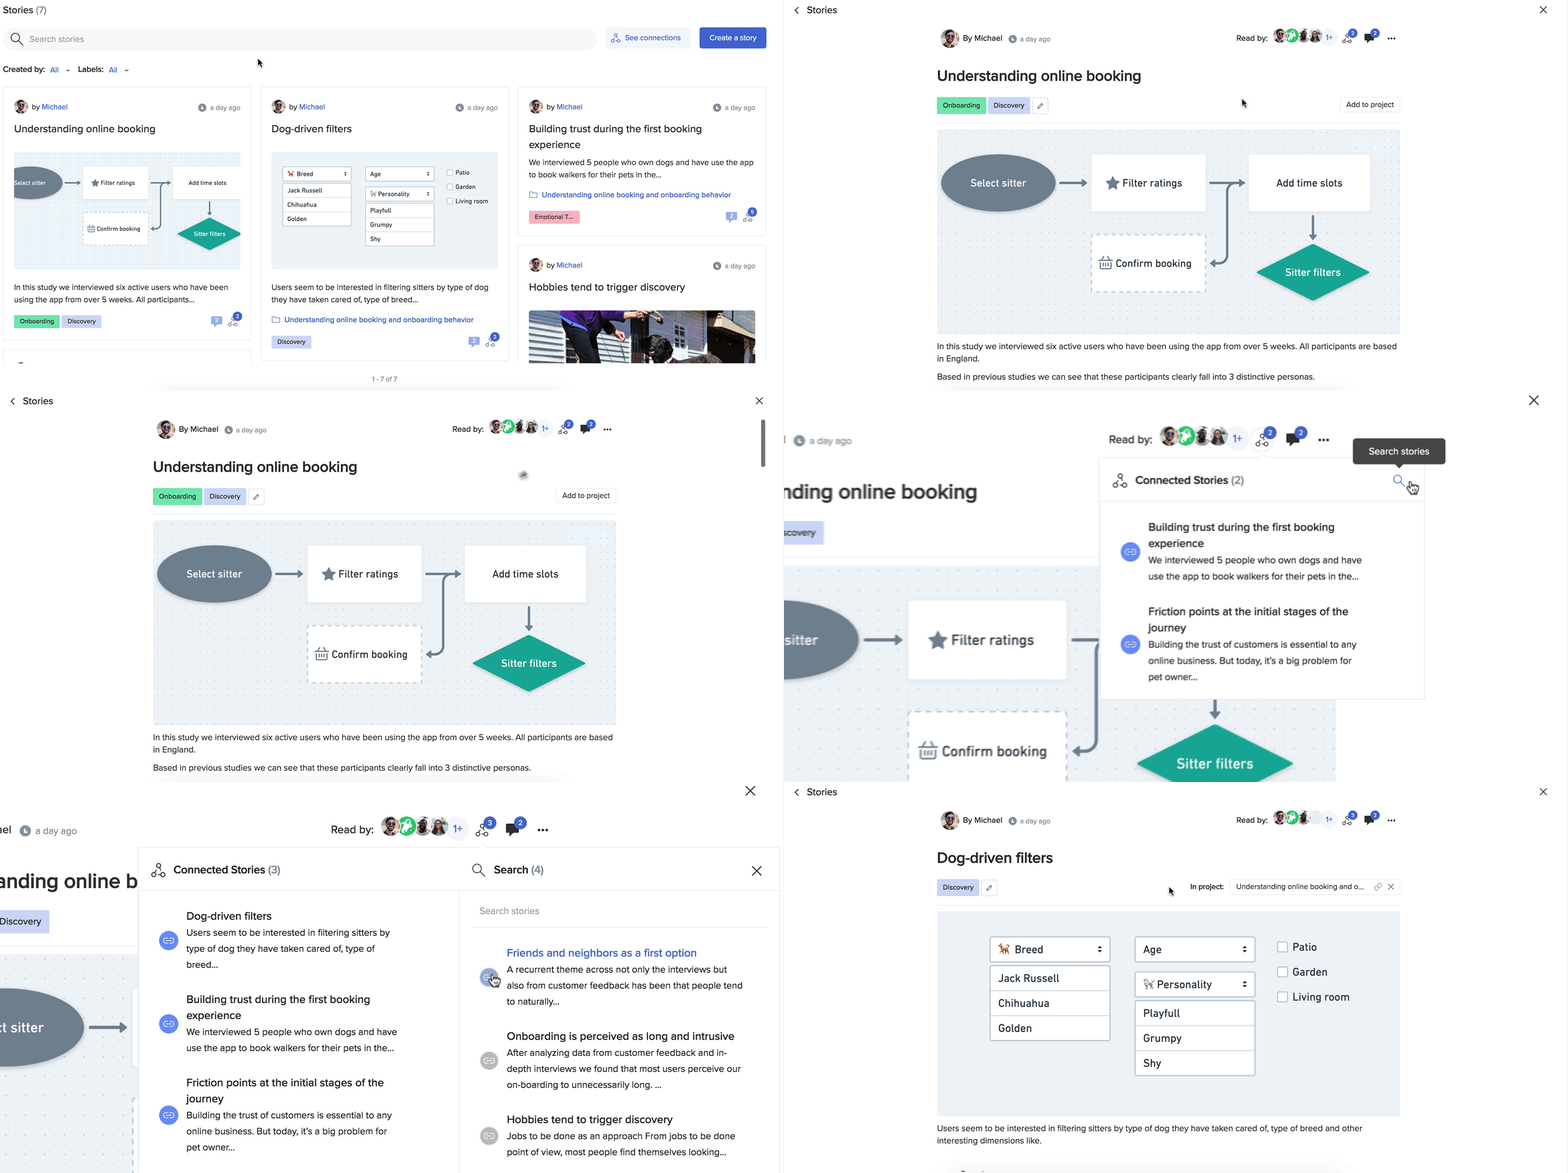
Once you have created a story, you can easily connect it to other stories and start mapping connections with previous research work. To do this, click on the “Connected Stories” icon in the top right corner of the Story editor. A searchable list of your stories will appear, allowing you to select the stories you want to connect.
Think about connections as recommendations for the reader. Like on Amazon: "If you read this, you may want to read this." Connections are meant to help people to discover insights that can give them more context on the topic/story they are reading.
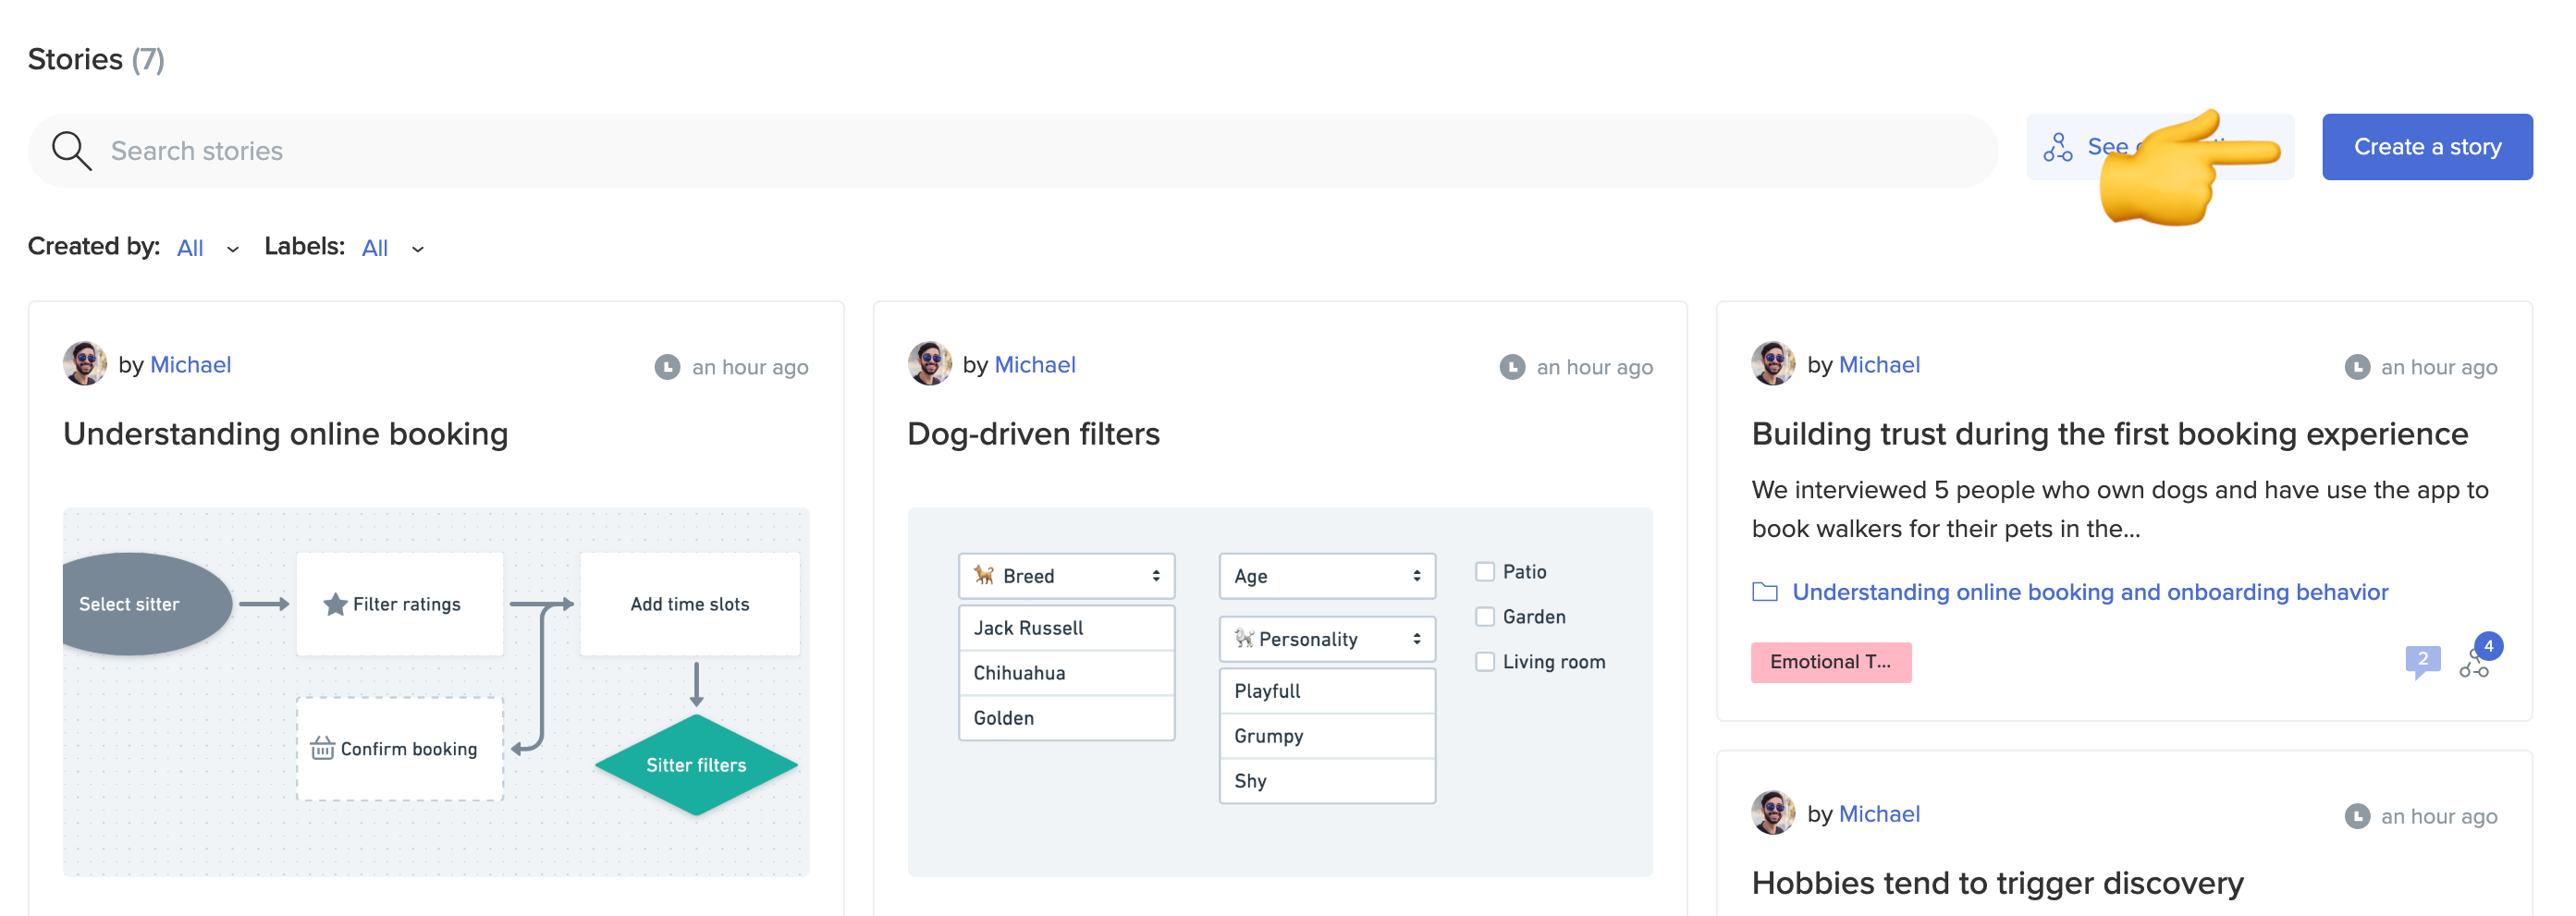
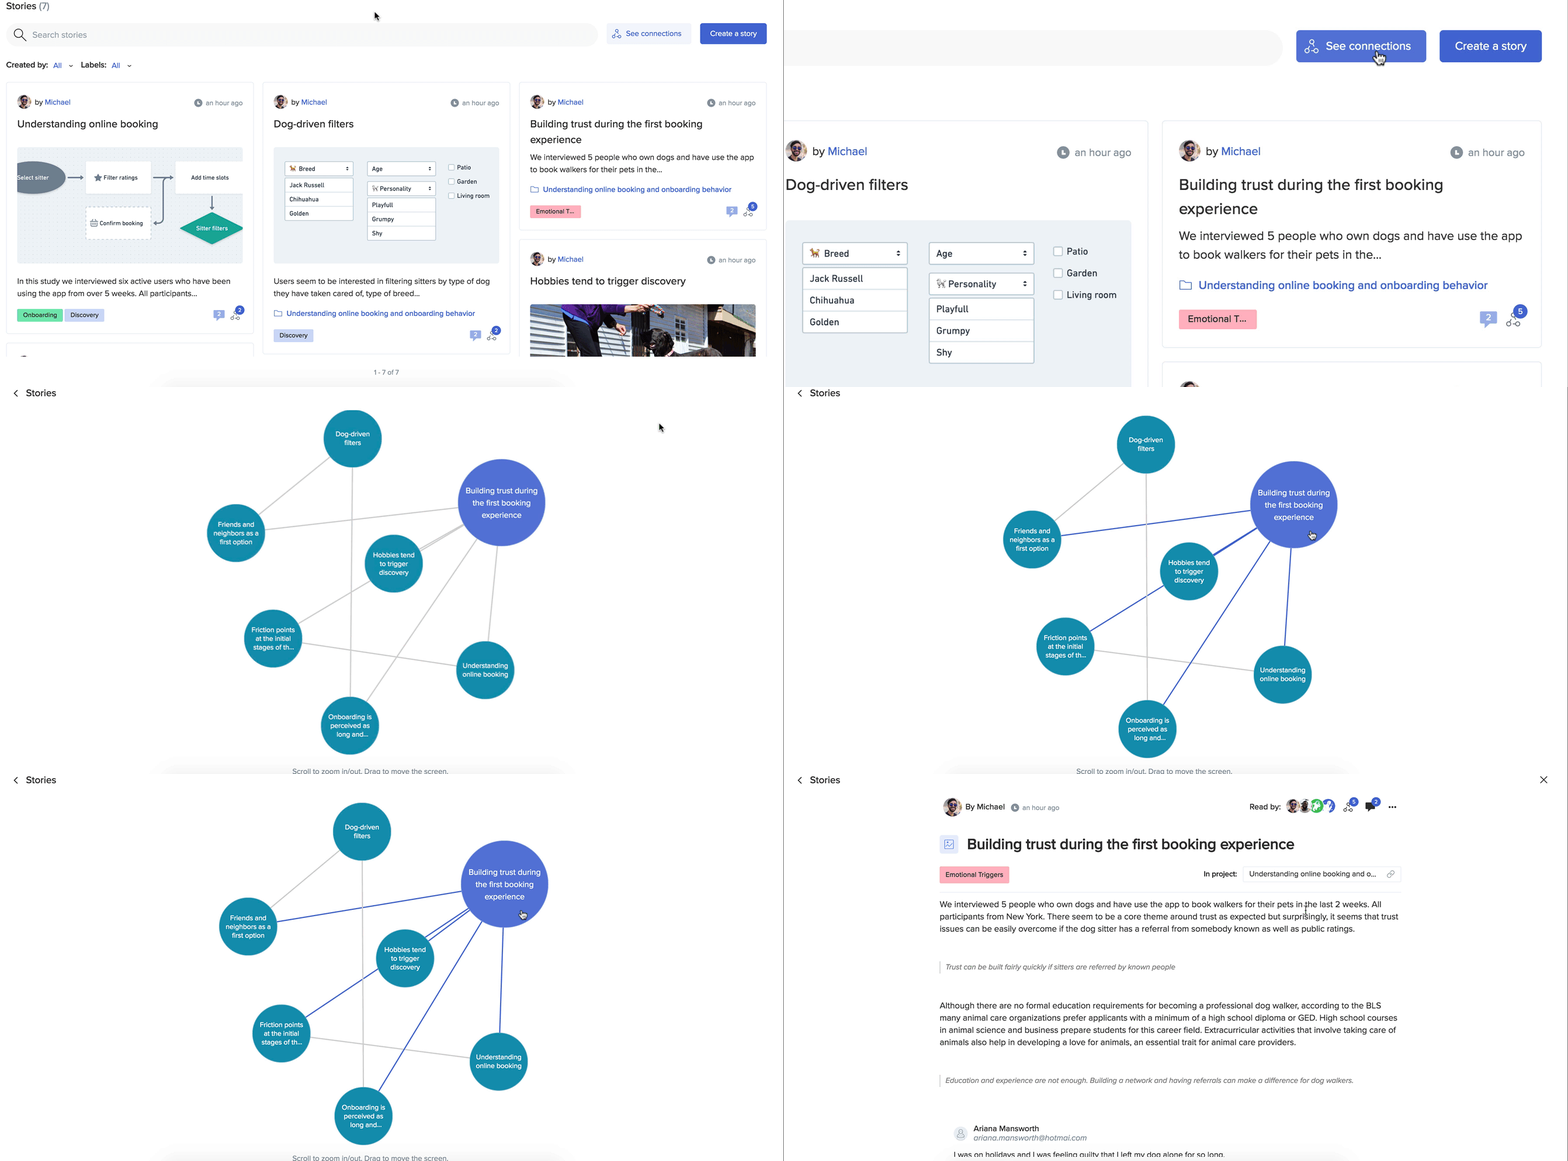
From the Stories tab, you can see a visualization of your connections by clicking the “See connections” button located in the top right corner. This will display a graph of your connected Stories, with each bubble representing a Story - the bigger the bubble, the more connections that particular Story has.
Connections can also serve as a visual way to navigate all your insights and engage your colleagues with your research work.
Commenting on Stories
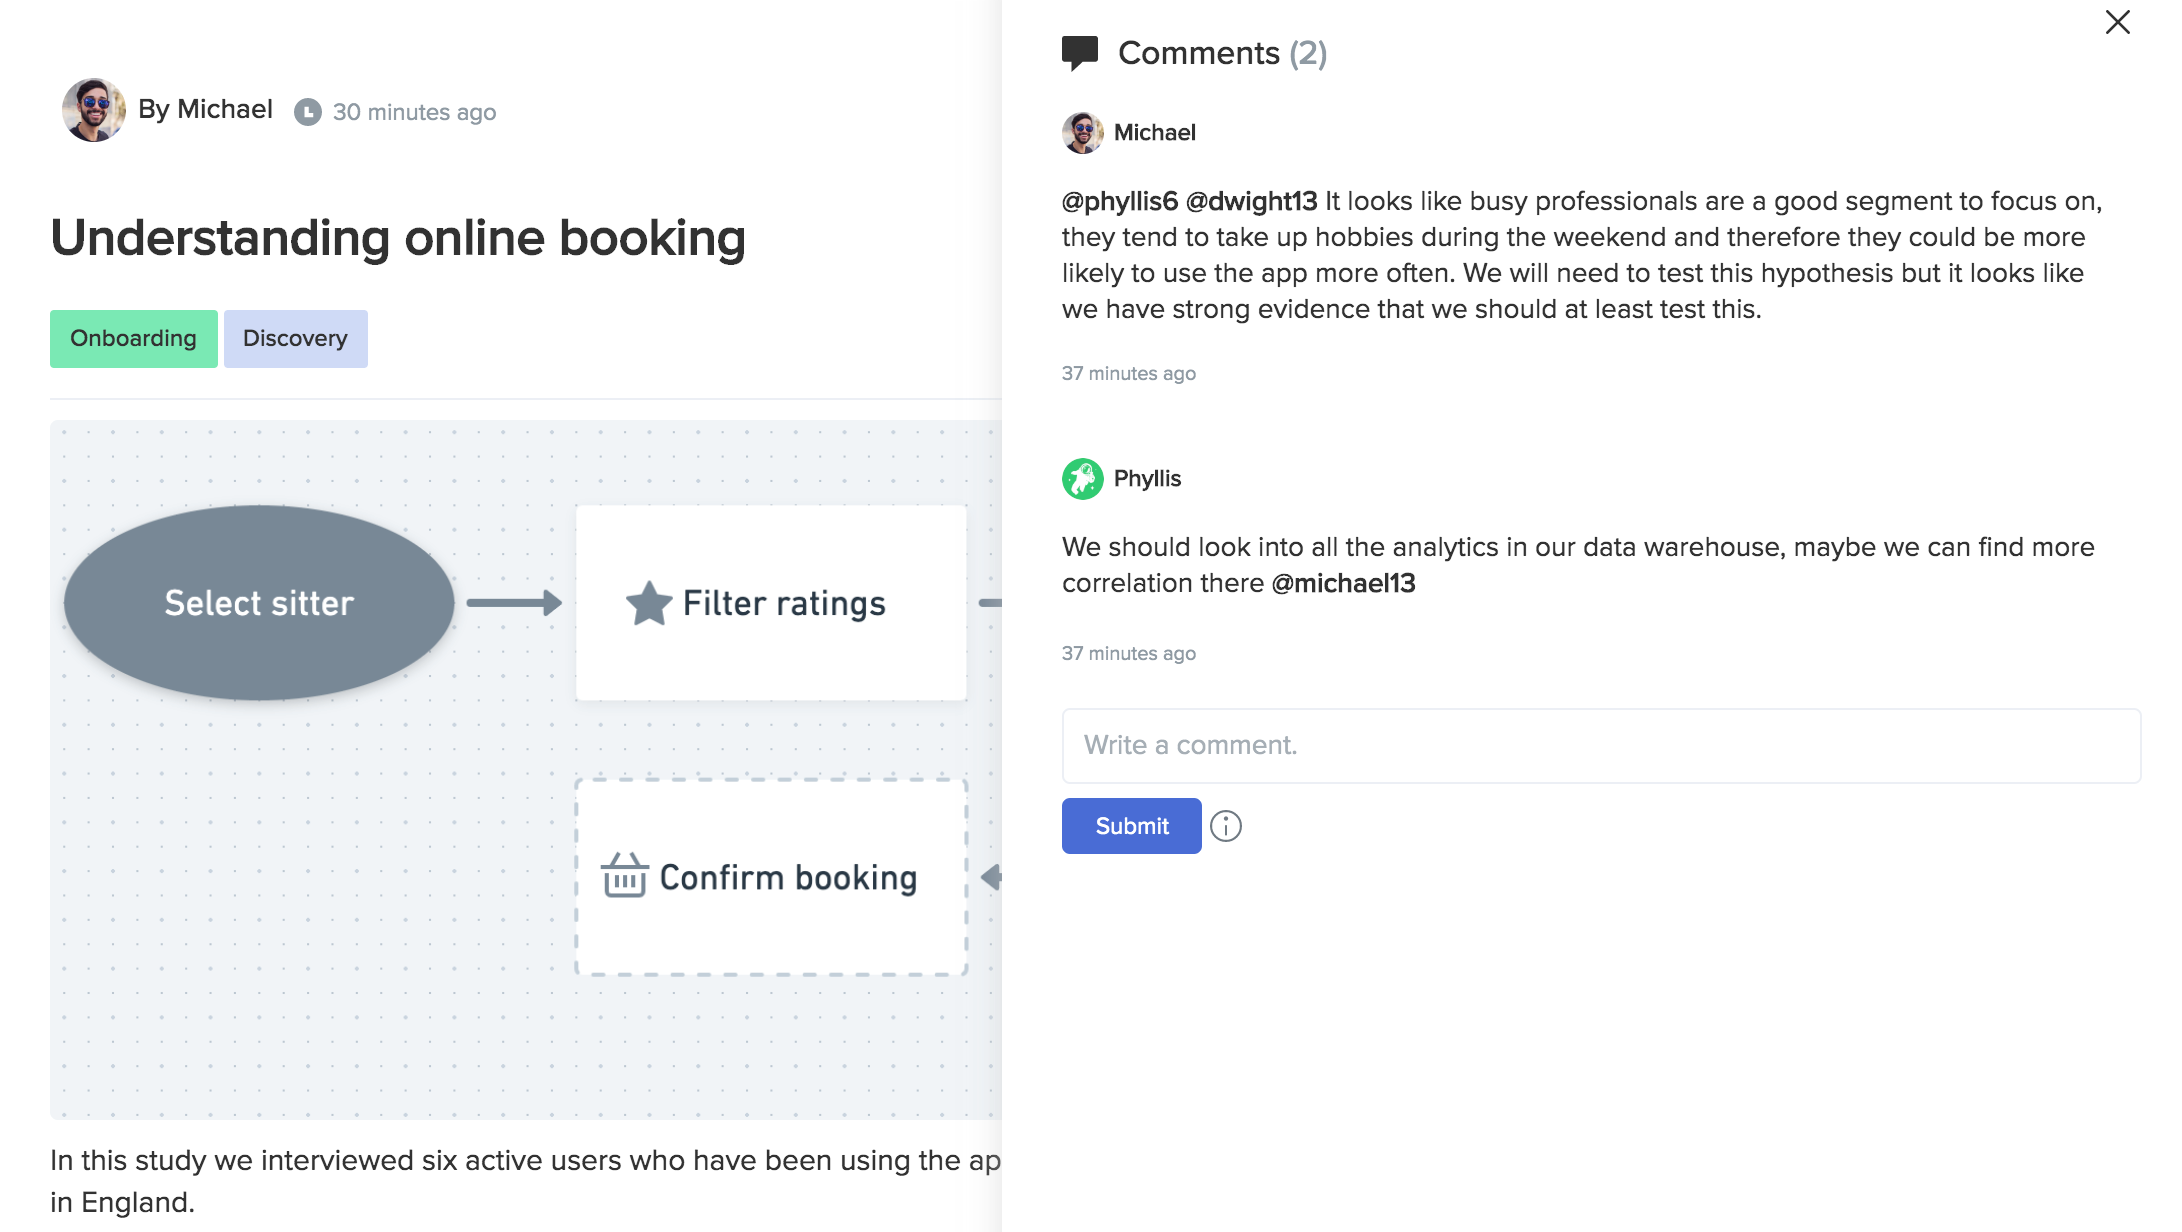
You can collaborate with team members within Stories using the comment section. Simply click on the icon in the top right, and a conversation window will appear.

You can mention team members in comments by typing @ followed by the name or the handle of a teammate.
Sharing Stories
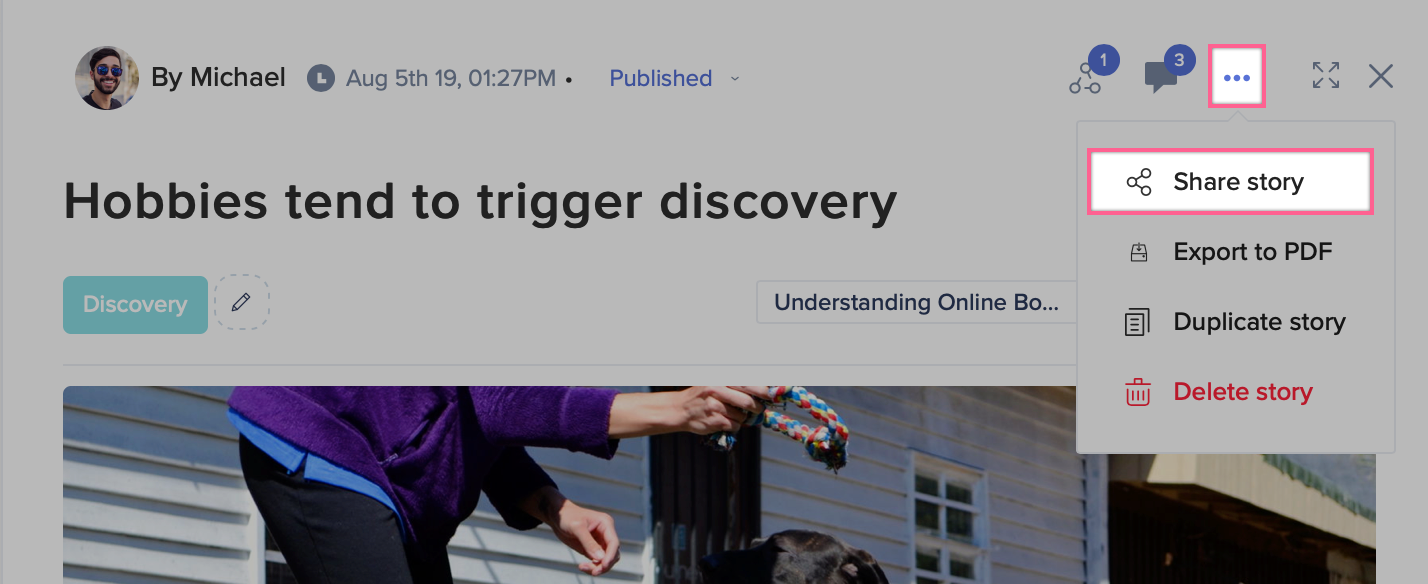
Sharing a Story works like sharing any item in EnjoyHQ - click the ellipsis in the top right corner of the Story editor and select “Share story”. A link to the Story will be created, which you can copy and share with anyone at your organization. If you’ve connected Slack or Trello to EnjoyHQ, you can share the link directly to those platforms.
Sharing respects EnjoyHQ's permission and roles - meaning only administrators and collaborators can change aspects of your Stories.
Exporting Stories as PDFs
Any story can be exported as a PDF file with one click - you can find the "Export to PDF" option in the More menu:

FAQ
- Who can access Stories?
A: Stories can be viewed and commented on by any user in your EnjoyHQ account. Only administrators and collaborators can edit stories. Read-only users can see all stories in the Stories section or Stories featured in a Project’s report as long as they're published
- Who can comment on Stories?
A: Any EnjoyHQ user can comment on stories, including read-only users.
- What is the difference between Project Reports and Stories?
A: Project Reports are a collection of one or more featured Stories created during the research process within a project. The report is meant to showcase the key findings and insights of a project. All Stories created within the project can be viewed in the Stories section.
- Can I use Stories to migrate my previous research data?
A: Absolutely! Previous research findings and insights can be migrated into Stories, allowing you to add context to your work while also making your findings searchable.
- What is the difference between Insights and a Story?
A: In EnjoyHQ, Insights refer to pieces of information that have been highlighted in a Project Data section. A Story is used to add context to your research insights, which could include attaching one or multiple Insights to your Story.
- How can I group multiple Stories and share them with my team?
A: You can connect multiple Stories together by clicking on the connections icon in the Story editor. You can then share a link to your Story with your team, who will be able to view a read-only version of your connected Stories.
Stories can also be organized with labels, allowing you to assign a common label to a set of Stories, which can also be optionally connected. An example of common labels would be “Initial Research Findings", “User Interviews Report", “UserTesting Insights” to indicate which phase of research the Story relates to.
You can save pre-configured Categories in the Stories list and share them with your colleagues.
Lastly, you can create a separate Project and all your stories to its report and share that project.
- Are attached files in Stories searchable?
A: Not at the moment, but it is something that we are planning to address in the near future. You can, however, embed any document or highlight, which are always available in the search area.
- Can I create story templates?